What is RAG (Retrieval-Augmented Generation)? A Marketer's Guide
by Shai Belinsky9 Min.
Oct 01, 2026
I had 48 hours before a meeting with the SVP of Marketing and CMO of a big UK health and beauty brand (To avoid disclosing our clients’ data, I’ll refer to them as “OurExampleBrand” throughout the article).
The brief: make them understand why their AI search visibility gap was a commercial problem: not a technical curiosity, not something to file under “watch this space.” A revenue problem. The kind that compounds quietly until someone notices a category they used to own has been redefined without them.
Here’s what makes that brief unusual: OurExampleBrand didn’t know they had a gap. They had no mechanism to know. Most brands don’t.
The AI visibility problem has a second, less-discussed layer. The first layer is the gap itself: brands that dominate web search but barely register in responses from ChatGPT and Perplexity. The second layer is that nobody tells you this is happening. There’s no Google Search Console equivalent for LLM presence.
No dashboard lights up red when your brand stops appearing in AI-generated answers. Clients with strong web performance reasonably assume that their digital strength translates across search surfaces. It often doesn’t. They find out when someone builds the mirror and puts it in front of them.
That’s what this article is about. Not just the technical workflow, but why it matters that we build these dashboards proactively, before clients ask. Because they can’t ask for what they don’t know how to look for.
I didn’t build a slide deck for that meeting. I built a dashboard.
Using Claude with the Similarweb MCP connector active, I produced a fully interactive, tabbed AI Search Intelligence dashboard as a Claude artifact in a single session. No HTML. No CSS. No developer dependency. One prompt, real data, a client-ready deliverable.
This is the step-by-step.
A quick note before we start: I am not a developer. I didn’t write a single line of code in this process. What I did was write a detailed brief in plain English and let Claude execute it, with Similarweb’s data flowing directly through the connector. If you can write a creative brief, you can do this.
The method is spreading fast. This article explains it precisely.
A Similarweb AI Search Intelligence dashboard is a client-facing, interactive visualization that layers three data sources into a single coherent narrative: traditional web traffic and market share, AI platform visibility metrics (how often a brand appears in LLM responses compared with competitors), and a prioritized action plan derived from the gaps between the two.
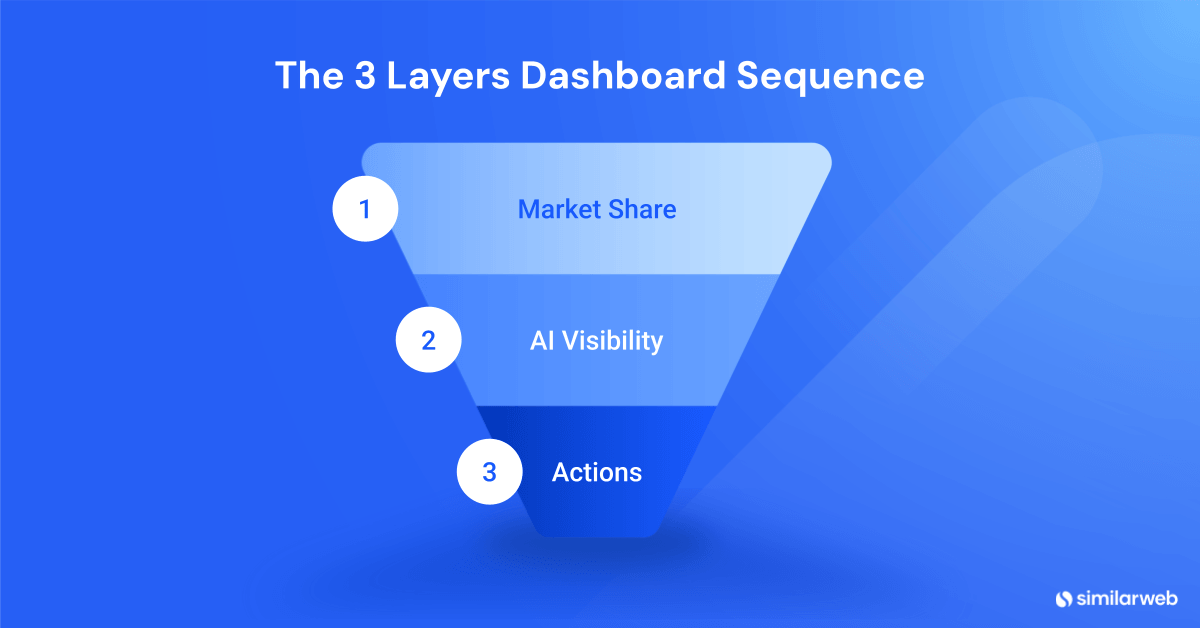
The reason the three-layer structure matters is that it controls the sequence of the argument. You don’t open with the problem. You open with the client’s strength.
Every dashboard I build for a client meeting follows the same flow:
Tab 1: Market share: Establish the client’s web dominance. Traffic share, engagement, growth trend versus competitors. This creates credibility before the uncomfortable part.
Tab 2: AI visibility: Show where that dominance fails to carry into AI platforms. Prompt coverage rate, brand mention rate by LLM, sentiment distribution, share of voice in AI responses versus competitors. This is where the tension lands.
Tab 3: Actions: Connect the gap to a specific response. Content gaps, third-party citation opportunities, and outreach targets. The dashboard doesn’t just show a problem, it points to the fix.
For the ourexamplebrand.com session, the market share tab confirmed what the team already knew:
The AI visibility tab told a different story entirely. More on that in Step 5.
When you’re building an AI visibility dashboard for a client, there are seven metrics that matter: Brand mention rate (AI Share of Voice), Mention rate by LLM, Sentiment distribution, Prompt coverage, Web market share, Traffic growth, and Zero-brand rate.
| Metric | What it measures | Data source |
| Brand mention rate | % of tracked prompts where the brand appears | Similarweb AI Search Intelligence |
| Mention rate by LLM | Breakdown across ChatGPT, Perplexity, Gemini, Google AI Mode | Similarweb AI Search Intelligence |
| Sentiment distribution | Positive/neutral/negative when mentioned | Similarweb AI Search Intelligence |
| Prompt coverage | % of tracked queries returning any brand response | Similarweb AI Search Intelligence |
| Web market share | Traffic share vs competitors | Similarweb Web Traffic Intelligence |
| Traffic growth trend | Month-over-month direction vs category | Similarweb Web Traffic Intelligence |
| Zero-brand rate | % of queries returning no brand at all | Similarweb AI Search Intelligence |
Understanding these metrics up front matters because they determine what you ask Claude to build, which brings us to the setup. For a deeper dive into tracking these metrics over time, see Similarweb’s guide to tracking AI brand visibility.
Before you write a single word of your prompt, one thing needs to be active: the Similarweb connector enabled in your Claude account. That is the entire setup. No code, no config files, no terminal.
Claude supports MCP connectors natively. When the Similarweb connector is active, Claude gets direct, real-time access to Similarweb’s data endpoints, including web traffic, keyword intelligence, competitive benchmarks, and AI Search campaign data, through natural language. Claude automatically calls those endpoints whenever your prompt requires it and returns the results as part of a generated artifact.
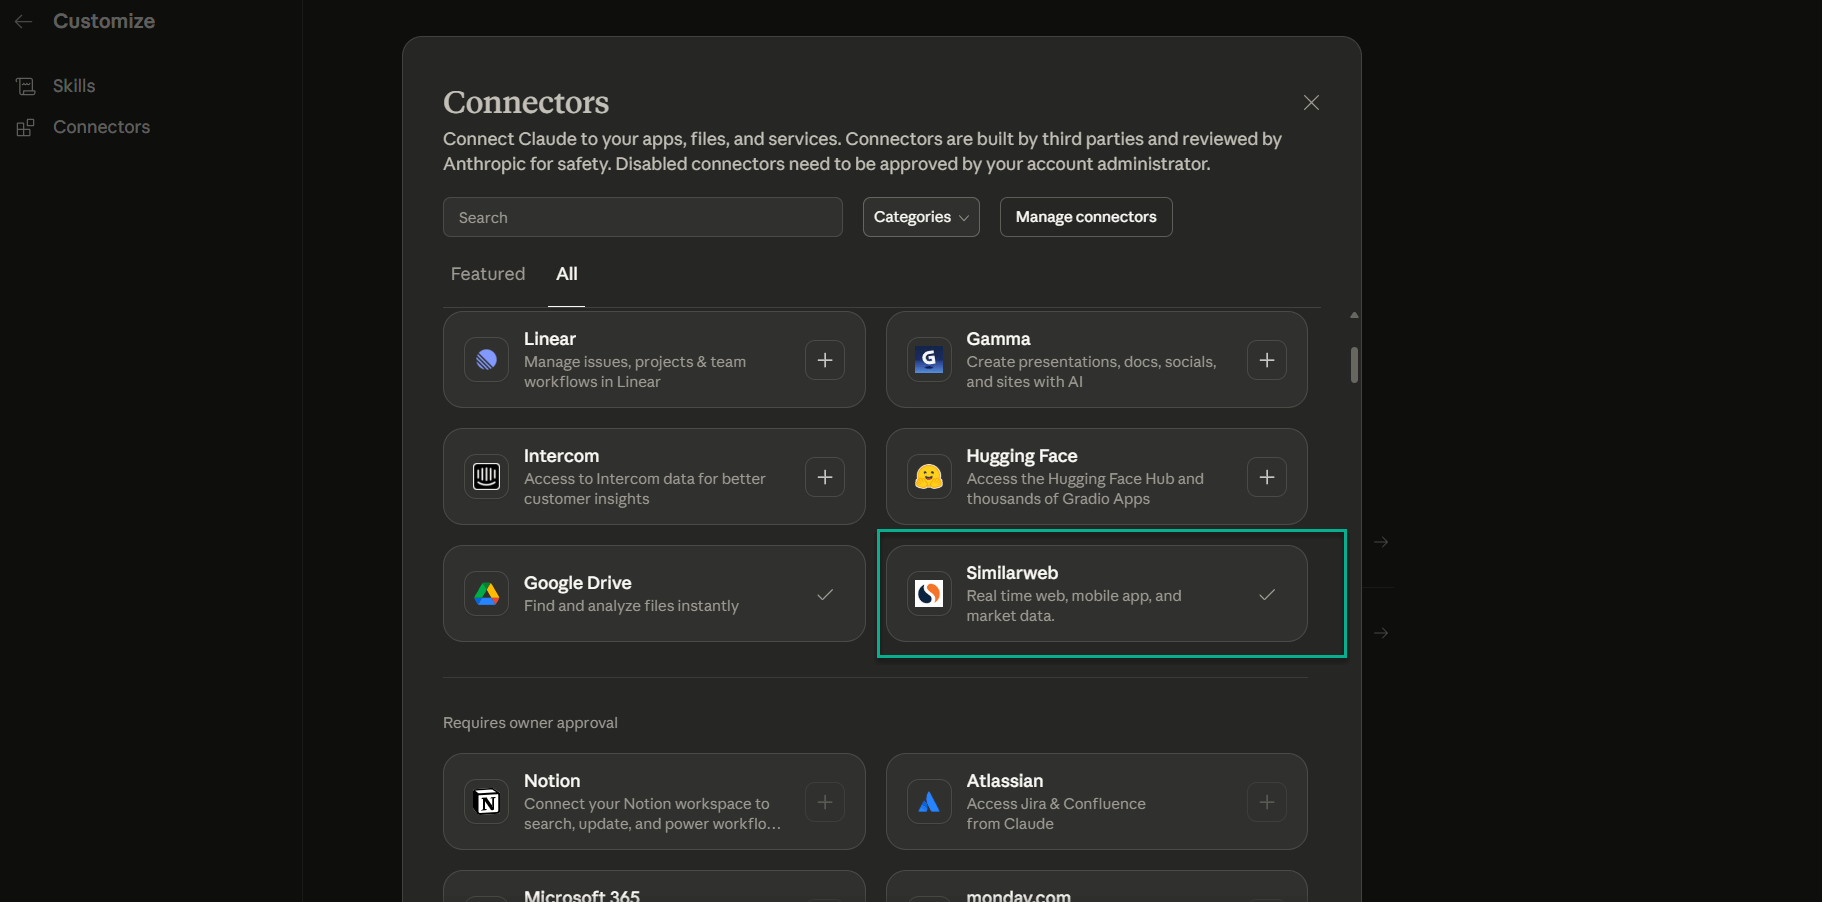
That is the full setup. The connector handles authentication, endpoint routing, and data formatting automatically.
The Similarweb MCP connector is available on API-only, Business, and Enterprise plans. The AI Search Intelligence data used in this dashboard, specifically the AI Brand Visibility campaign analysis, requires either the AI Search Intelligence add-on or a Business/Enterprise plan that includes it. Similarweb’s standalone AI Search Intelligence starts at $99/month and includes AI Traffic and AI Brand Visibility modules.
One rule that applies to every session: If the connector is unavailable or the data endpoints return errors, stop. Do not estimate. Do not substitute public estimates or third-party data for Similarweb numbers. A client deliverable built on guesses is worse than no deliverable at all, and it’s entirely avoidable.
For campaigns with many tracked prompts, Claude’s context window can fill before it has processed the full dataset. The dashboard in this article was generated as a Claude artifact, which handles large MCP responses well. If results appear truncated, reduce the date range or prompt count in your campaign before re-running.
The API limit parameter in your prompt (covered in Step 4) also controls how many records the Similarweb endpoint returns per call. Setting this explicitly ensures Claude requests the full dataset rather than the default 100 results.
Before you build the dashboard, you need the data it will pull from. That means an active AI visibility campaign in Similarweb AI Search Intelligence, set up at least 24 to 48 hours before your meeting to give the platform time to populate results.
An AI brand visibility campaign in Similarweb consists of four components: the prompts you want tracked (the questions real consumers ask AI platforms about your category), the competitor domains you’re benchmarking against, the date range for analysis, and the country scope.
For OurExampleBrand, the campaign covered ten topic categories: Men’s Fragrances, Women’s Fragrances, Hair Styling Tools, Body Moisturizers and Ointments, Facial Skincare Brands, Oral Care Devices, Hair Loss Treatments, Flu Vaccination Booking, Prescription Weight Loss Injections, and Erectile Dysfunction Medicines.
The pharmaceutical and clinical categories matter particularly for OurExampleBrand: they represent territory where OurExampleBrand’s pharmacy credentials give it a clear competitive advantage over beauty-only rivals like Competitor 2 and LookFantastic, making its AI invisibility in these categories most commercially damaging.
Once the campaign has run for at least 24 hours, it’s ready to pull into the dashboard. The Similarweb MCP will retrieve prompt-level data, including brand mentions, citations, and sentiment for every tracked query, and Claude will call it automatically when you include the campaign ID in your prompt.
The dashboard is produced as a Claude artifact in your conversation.
This is the step where most practitioners stall. “What do I actually write?” The answer is: a structured brief, not a search query. Claude does not need code instructions. It needs context, scope, and a clear output specification.
The output it produces is an interactive HTML artifact rendered directly in the conversation.
Below is the prompt I used to create the dashboard. You can copy it and use it for your own AI brand visibility campaign if you have a Similarweb subscription.
I am meeting with the SVP Marketing and CMO at ourexamplebrand.com UK. Please help me create an interactive one-pager dashboard with tabs on top of the page that auto-scroll down to the right and the applicable section.
Please provide a top-level market share section based on the competitors below:
https://www.Competitor 1.com
https://www.lookfantastic.com
https://www.Competitor 2.co.uk
On the market share tab, include a section about “Increase of adoption of AI tools in the beauty sector.” Pull in external sources and texts to support this. Cite all sources.
I also want a dedicated section (the main part of the dashboard) around AI search visibility, AI market share, and AI trends for OurExampleBrand vs competitors.
I have launched a GenAI campaign so we can examine the prompts, responses,citations, sentiment, and brand visibility vs competitors. Provide a holistic view and also a breakdown across all available LLMs.
GenAI campaign start date: March 15, 2026
GenAI campaign end date: March 26, 2026
Where necessary, extend the return limits of the API to capture sufficient data.
All of the analysis should focus on the UK as a country.
GenAI campaignId = xxxxxxx
Lastly, include a section on actions to increase AI search visibility. If outreach is suggested, provide outreach templates. Only suggest outreach to relevant sites. Competitors, YouTube, Reddit, and similar are not relevant.
What each parameter does
Meeting context (“I am meeting with the SVP Marketing and CMO”) is not pleasantry. It signals to Claude the required communication level: executive-facing, persuasion-first, not a technical analysis. The output will be structured accordingly.
Competitor URLs passed as full hyperlinks trigger the Similarweb MCP to pull live traffic and engagement data for each domain: get-websites-traffic-and-engagement, get-websites-traffic-sources, and related endpoints fire automatically.
“Increase of adoption of AI tools in the beauty sector” is a context-setting section instruction. Claude will search for supporting statistics and cite them inline, giving the client immediate category context before hitting the visibility data.
The campaign ID is the critical data parameter. When included, Claude calls get-gen-ai-campaign-analysis-prompts with the full set of metrics: prompts, responses, brand mentions, citations, and sentiment. This is the proprietary data layer that makes the dashboard inseparable from public sources.
“Extend the return limits” tells Claude to increase the limit parameter in the get-gen-ai-campaign-analysis-prompts API call, from the default of 100 results up to whatever the campaign requires (1,000 in this case).
This is separate from the MAX_MCP_OUTPUT_TOKENS environment variable set in Step 2, which controls how much output Claude can receive. This controls how much the Similarweb API returns in the first place. For a 1,000-prompt campaign, you need both.
“Only suggest outreach to relevant sites” is a filtering instruction that prevents the actions tab from producing useless recommendations. OurExampleBrand doesn’t need to pitch itself to its own competitors’ domains. The dashboard should identify editorial, review, and health authority publications where a mention of OurExampleBrand would earn genuine AI citations.
| Endpoint | What it returns |
| get-gen-ai-campaign-analysis-prompts | Prompt-level AI visibility data: mentions, sentiment, citations per LLM |
| get-websites-traffic-and-engagement | Visits, bounce rate, engagement metrics per domain |
| get-websites-traffic-sources | Channel breakdown for each competitor |
| get-websites-referrals-agg | Referral sources, including AI platform traffic |
Claude coordinates all four calls in a single session, assembles the data, and produces a complete interactive HTML artifact. In the OurExampleBrand session, this took approximately six minutes from prompt submission to a downloadable, presentation-ready dashboard.
The ourexamplebrand.com dashboard produced by this workflow contained five tabs, each building on the last.
The structure is worth understanding in detail, because the sequencing is deliberate: it moves the conversation from strength to risk to evidence to action, without ever losing the thread.
The first tab opens on OurExampleBrand’s web position: 31.7 million average monthly visits over December 2025 to February 2026, a 58.4% share of combined UK beauty and health retail traffic, ahead of their competitors.
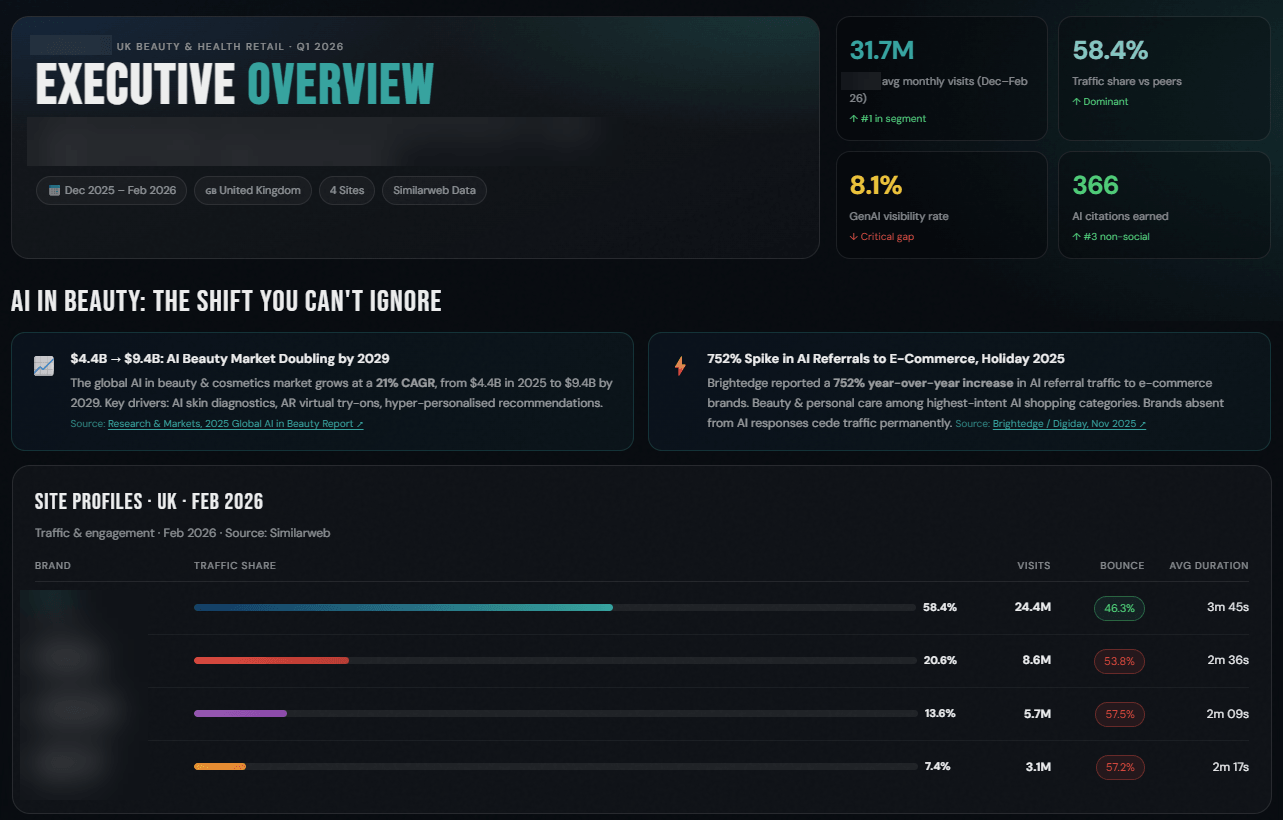
The tab also surfaced the industry context: AI referral traffic to e-commerce sites grew 752% year-on-year in late 2025 (Brightedge), and 34% of UK consumers now use AI for health and beauty purchase research (Adobe Business Intelligence, 2025).
This tab does one job. It establishes that OurExampleBrand is the clear market leader, with data the team already knew but hadn’t seen benchmarked in this format. Once that is in the room, the next tab lands harder.
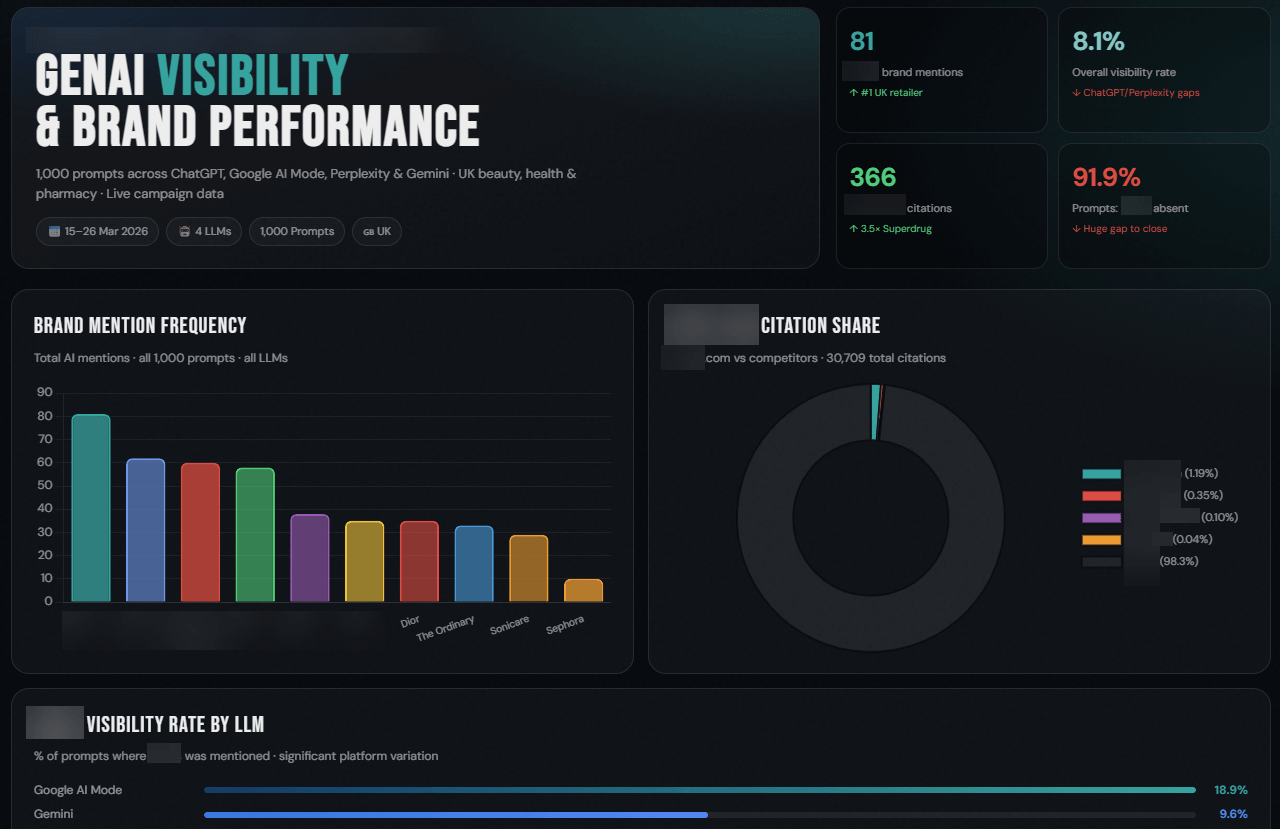
The second tab presents the full AI visibility picture from the Similarweb AI Brand Visibility campaign: 1,000 prompts across ChatGPT, Google AI Mode, Perplexity, and Gemini, run across ten UK health and beauty topic categories over the campaign window.
The headline numbers: OurExampleBrand appeared in 8.1% of AI responses overall, earned 366 citations (3.5 times Competitor 1’s citation count), but was absent from 91.9% of prompts.
The platform breakdown by LLM is where the strategic problem becomes visible:
| LLM platform | OurExampleBrand visibility | Competitor 1 visibility | Competitor 2 visibility |
| Google AI Mode | 18.9% | 13.5% | 0.0% |
| Gemini | 9.6% | 7.0% | 0.9% |
| ChatGPT | 2.8% | 1.6% | 2.8% |
| Perplexity | 1.2% | 1.9% | 0.4% |
OurExampleBrand leads on the two platforms inside Google’s ecosystem. On the two platforms that operate independently of it, it is nearly invisible, and on Perplexity, it trails a smaller competitor.
The third tab gives the per-platform breakdown in full. The data here make the presentation concrete rather than directional.
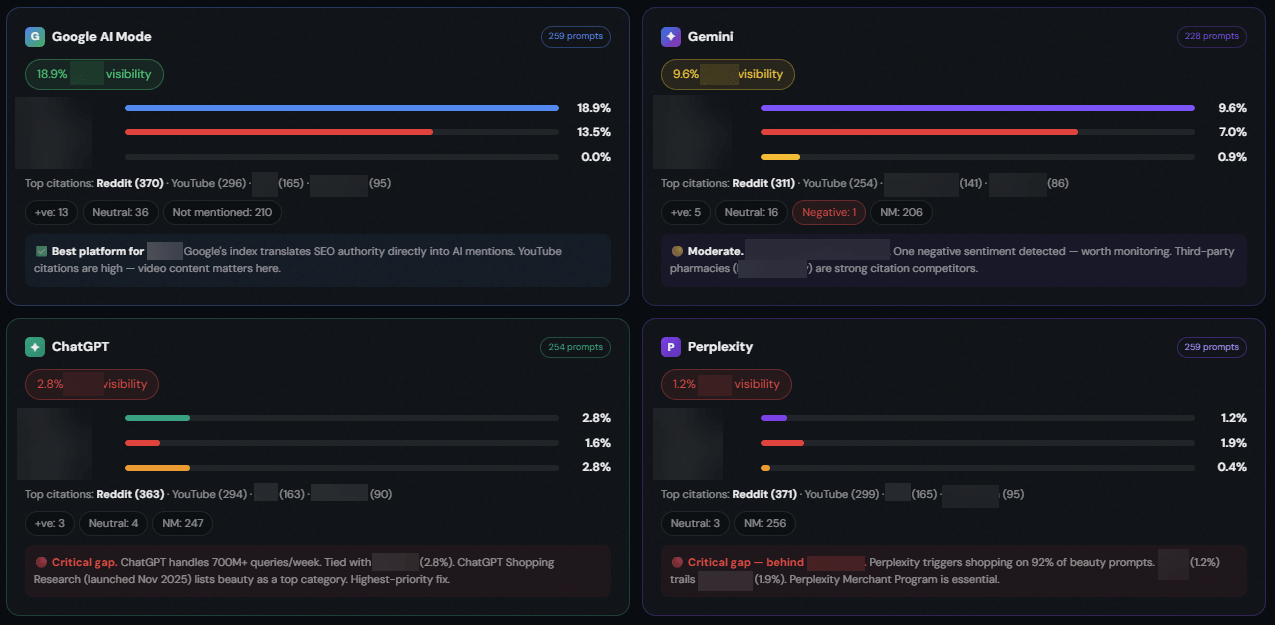
On Google AI Mode (259 prompts): OurExampleBrand at 18.9%, with Reddit, YouTube, and NHS as the top citation sources. Sentiment 13 positive, 36 neutral. The note in the dashboard is accurate: Google’s SEO index translates directly into AI visibility here.
On Gemini (228 prompts): 9.6%, with a notable citation presence from BoltPharmacy, a smaller pharmacy competitor, alongside Reddit and YouTube. One negative sentiment flagged.
On ChatGPT (254 prompts): 2.8%, tied with Competitor 2. ChatGPT processes over 900 million active users per week and launched a Shopping Research feature in November 2025 with beauty as a top-five category. OurExampleBrand’s presence here is the most commercially urgent gap.
On Perplexity (259 prompts): 1.2%, behind Competitor 1s’ 1.9%. Perplexity triggers shopping suggestions on 92% of beauty prompts. The platform most likely to drive direct purchases is the one where OurExampleBrand ranks second.
The practical framing for the room: OurExampleBrand’s Google ecosystem advantage is real, but it is the result of 20+ years of SEO investment. ChatGPT and Perplexity don’t inherit that authority. They synthesize from third-party editorial sources, structured product data, and merchant program participation: signals OurExampleBrand has not yet built for.
This tab presents the five sharpest findings from the campaign data as a briefing format, each with an expandable action set.
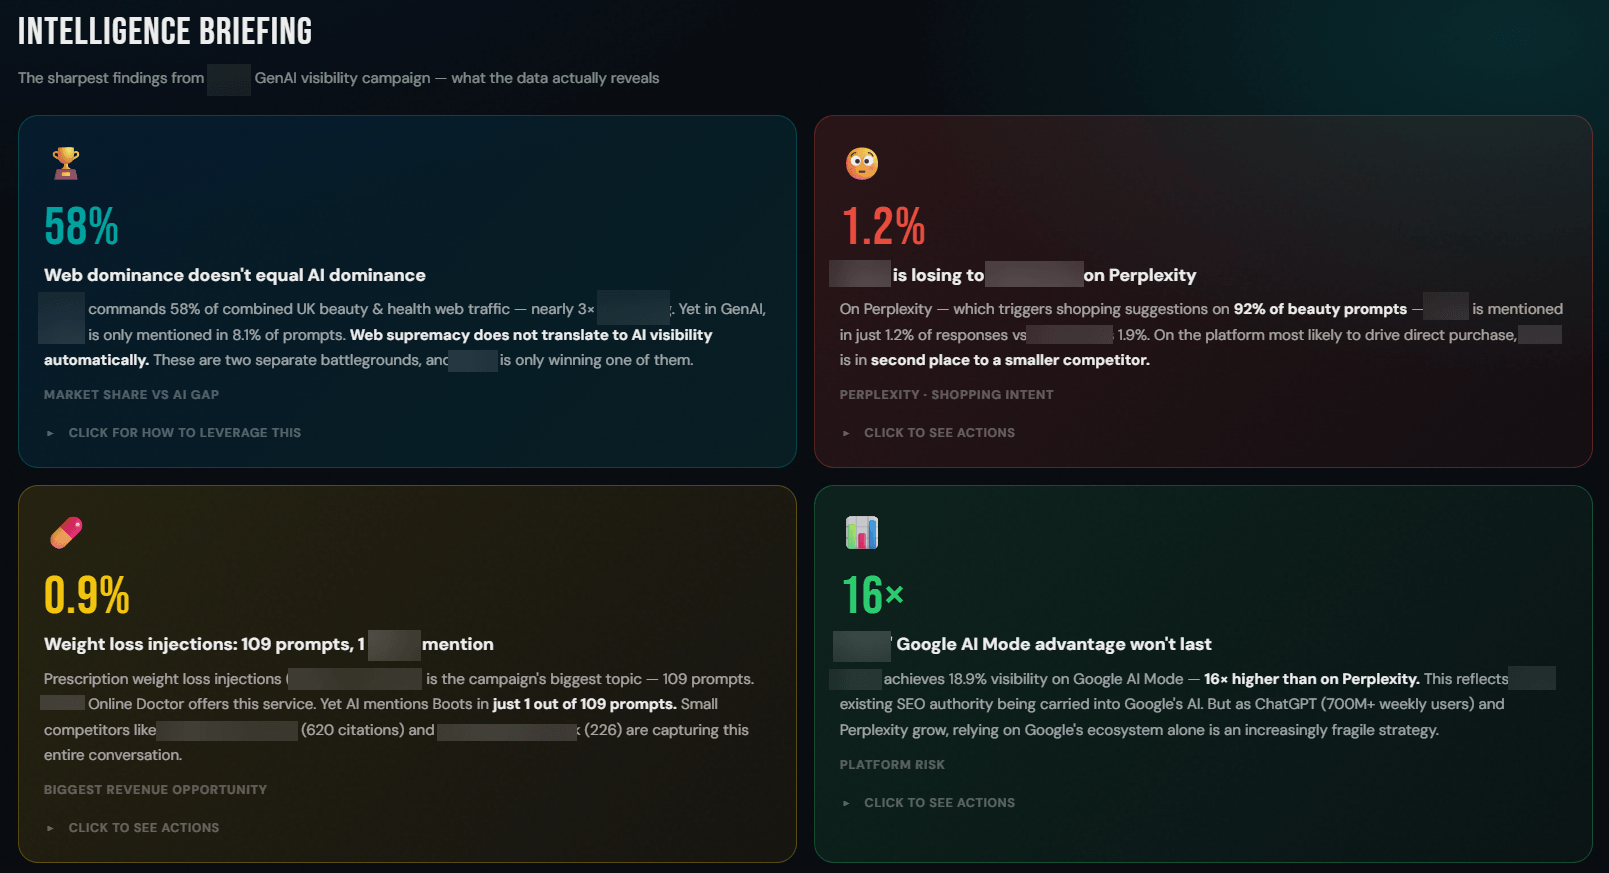
The finding that landed hardest in the meeting: OurExampleBrand commands 58% of UK health and beauty web traffic, nearly three times its competitors’ share. It is mentioned in 8.1% of AI prompts. But web supremacy does not translate to AI visibility automatically. These are two separate battlegrounds.
The most commercially specific finding: prescription weight loss injections generated 109 prompts in the campaign, the largest topic cluster. OurExampleBrand, which offers this service through its online platform, appeared in just one of those 109 prompts: 0.9% visibility.
Smaller competitors are capturing nearly the entire conversation.
A secondary finding with direct competitive implications: The competitor’s online service earned 130 citations in the campaign, versus OurExampleBrand’s 71, despite OurExampleBrand having a significantly larger pharmacy network and longer-established health services.
The fifth tab translated everything above into a prioritized six-action playbook, each with ownership, timeline, and execution steps.
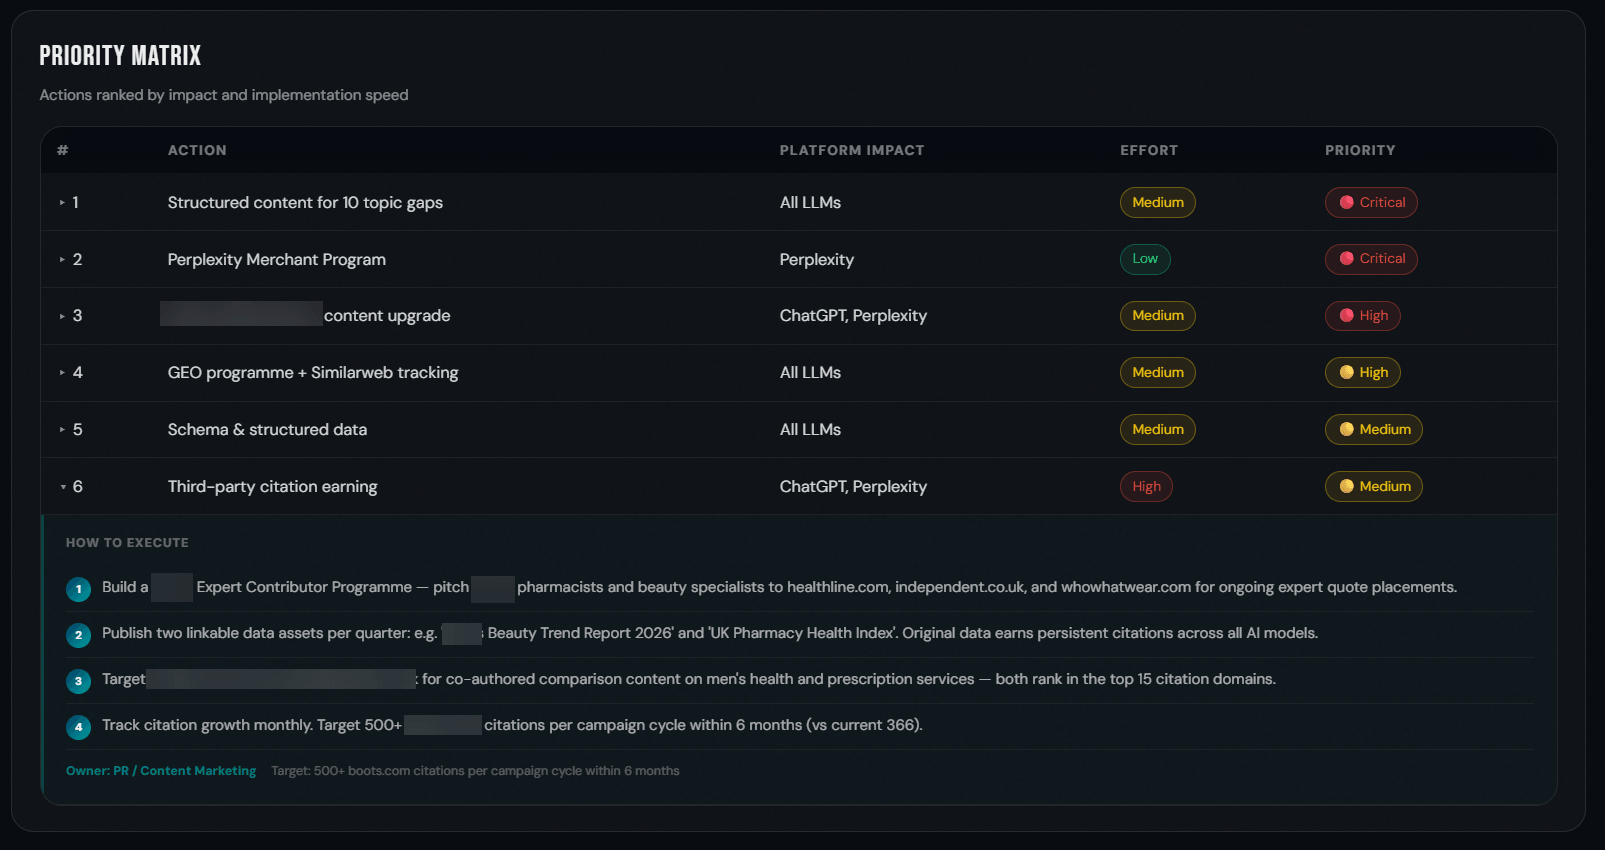
The dashboard generated outreach recommendations for third-party citation targets based on which domains AI platforms are already citing in this campaign. The leading non-social citation sources were NHS.uk (633 citations), boltpharmacy.co.uk (620), and oxfordonlinepharmacy.co.uk (254).
Only 25% of AI citations in the campaign came from brand-owned domains. The rest came from third-party editorial, health, and comparison sites, which is exactly the citation infrastructure OurExampleBrand needs to build.
Per the prompt instructions, outreach templates were generated only for relevant editorial and authority sites. Competitor domains, YouTube, and social platforms were excluded from the recommendations.
One point worth naming directly: Before this dashboard session, OurExampleBrand had no visibility into any of this. They knew their web performance. They had no equivalent signal for AI platform presence. This is not a failure on their part, it reflects the current state of most enterprise marketing organizations.
The tooling for measuring AI visibility is new, the data layer is proprietary, and the workflow for surfacing it in a client-ready format didn’t exist in an accessible form until very recently.
The dashboard didn’t just reveal a gap. It revealed a gap that nobody at OurExampleBrand had been able to quantify before that meeting, because there had been no mechanism to do so. Teaching clients to understand their AI visibility starts with showing it to them. You cannot optimize for a metric you cannot see.
This is the real reason to build these dashboards proactively, not reactively.
No client will come to you and say, “I think I have an AI visibility problem”, because they have no baseline to compare against. The initiative has to come from the practitioner side. Build the mirror first. Then put it in the room.
The five steps above are now my standard workflow before any senior-level client meeting that involves AI search as a topic.
It takes one session. What it produces is not a summary of the problem, but a quantified, interactive demonstration of exactly where the client is invisible, across which platforms, in which query categories, and what to do about it.
But I want to step back from the mechanics for a moment, because the deeper point in this workflow is not technical.
Most of the brands we work with do not know their AI visibility status. Not because they haven’t looked, but because they haven’t had the tooling or the workflow to look meaningfully. ourexamplebrand.com is a sophisticated digital operation with strong analytics capabilities.
They still had no line of sight into their LLM presence until that dashboard session. That is not unusual. It is, currently, the norm.
The gap between a brand’s web performance and its AI platform presence is often invisible to the brand itself. It compounds in silence. Consumers shift their discovery behavior. AI tools get trained on citation patterns that increasingly exclude certain brands. The web traffic numbers remain solid. Nothing triggers an alert.
Nobody asks the question because nobody has the answer readily available to prompt it.
This is why the practitioner’s role in AI search is not just analytical, but diagnostic. We are not waiting for clients to report symptoms. We are running the tests they don’t know to order. Teaching clients to understand their AI visibility requires, first, showing it to them in a format they can act on. That is what this dashboard does.
The ourexamplebrand.com data made an argument no slide could have made as cleanly: a category leader with 18.9% AI visibility on Google AI Mode, near-zero on ChatGPT, and absent entirely on Perplexity. The gap is not theoretical. It is measured, sourced, and broken down by platform.
That is the conversation that moves a decision. And it starts with building the mirror before the meeting, not because the client asked for it, but because once you show it to them, they can’t unsee it.
The data was always there. This is just the first time it was in the room. If you want to build the business case for this work internally, Similarweb’s AI visibility ROI guide covers the measurement framework.
To run this workflow yourself, start with Similarweb’s AI Search Intelligence to create your GenAI campaign, and Similarweb’s MCP documentation to connect the data layer to Claude. The five steps above scale to any industry, any market, and any client, as long as you have a campaign ID and the willingness to show them what they don’t yet know to look for.
What is an AI Search Intelligence dashboard and how is it different from a standard competitive report?
An AI Search Intelligence dashboard combines traditional web traffic and market share data with AI platform visibility metrics, specifically how often a brand appears in LLM-generated responses versus competitors, broken down by platform, prompt category, and sentiment. A standard competitive report shows web search performance. An AI Search Intelligence dashboard shows performance in the discovery layer that is increasingly replacing traditional search for high-intent consumer queries.
Why doesn’t strong web performance guarantee AI search visibility?
Web performance and AI platform visibility are measured by different signals. Google’s own AI Mode draws heavily on indexed web content, which is why web-dominant brands tend to perform relatively well there. But ChatGPT and Perplexity synthesize responses from a broader citation pool weighted toward editorially authoritative third-party sources, not just indexed web pages. A brand with dominant organic rankings but limited editorial presence in health, beauty, or category media may rank first on Google and appear in fewer than 1% of ChatGPT responses for the same query category.
Do I need coding experience to build this dashboard with Claude?
No coding experience is required. Claude accepts natural language instructions and generates a fully interactive HTML dashboard as an artifact, directly in the conversation. The only prerequisite is an active Similarweb connector in your Claude account, which takes about two minutes to set up in Settings. Writing a precise, well-scoped brief is the only skill this workflow requires. Claude handles the execution.
Which LLMs does Similarweb AI Search Intelligence cover?
Similarweb’s AI Brand Visibility tracks ChatGPT, Google AI Mode, Perplexity, and Gemini. In the ourexamplebrand.com campaign analyzed for this article, data was collected across 1,000 prompts: 259 on Google AI Mode, 259 on Perplexity, 254 on ChatGPT, and 228 on Gemini, over an eleven-day window in March 2026.
How do I turn dashboard findings into a client action plan?
The dashboard’s actions tab does much of this automatically, but the practitioner framing matters as much as the data. Findings should map to three response types: content gaps (topic clusters where the brand is absent and could earn citations through structured, authoritative content), third-party citation targets (editorial and review sites whose mentions translate to LLM citations), and platform-specific recommendations (since ChatGPT and Perplexity respond to different citation signals than Google AI Mode, strategies differ by LLM). The dashboard prompt template in Step 4 automatically generates outreach templates for each category.
What Similarweb subscription level is needed to run this workflow?
The AI Brand Visibility module with GenAI campaign creation is part of Similarweb’s AI Search Intelligence offering. The standalone AI Search Intelligence product starts at $99/month and includes AI Traffic and AI Brand Visibility. Note that the $99 plan includes 150 tracked prompts, which is suited to initial exploration and smaller campaigns. A campaign at the scale documented here requires a higher-tier plan or a custom arrangement through Similarweb’s sales team. Business and Enterprise plans with the AI add-on include full GenAI campaign capabilities. The Similarweb MCP server is available on API-only, Business, and Enterprise plans.
How long does the dashboard build take from start to finish?
Setting up the Similarweb MCP connection is a one-time process that takes under 10 minutes. Creating a AI search visibility campaign takes 15 minutes and should be done 24 to 48 hours before the meeting to allow the data to populate. Writing the prompt brief takes ten to fifteen minutes. Claude typically produces the complete HTML dashboard artifact in five to ten minutes. Total active build time, excluding the campaign data population window, is under 30 minutes per client.
Joel Janovsky is a Solution Architect at Similarweb, specializing in GenAI and Search Intelligence. Joel helps customers turn complex data into clear, actionable strategies that drive measurable growth.
Give it a try or talk to our insights team — don’t worry, it’s free!