What is RAG (Retrieval-Augmented Generation)? A Marketer's Guide
by Shai Belinsky9 Min.
Oct 01, 2026

You’re in a budget meeting. Your CMO asks: “We’re seeing competitors mentioned in ChatGPT responses. Do we have a plan to increase our own visibility for 2026? Should we invest in AEO? What’s the ROI?”
You have no answer.
Traditional SEO metrics don’t apply. You can’t measure impressions, track rankings, or calculate CPCs. AI platforms are black boxes. And every SEO agency gives you a different price with no clear methodology.
Meanwhile, Similarweb data from Q4 2025 shows AI discovery is exploding: 7 billion monthly web visits to generative AI platforms, up 76% year-over-year. Gen AI referrals to transactional sites grew 357% YoY, and those visitors are converting at approximately 7% (higher than many traditional channels).
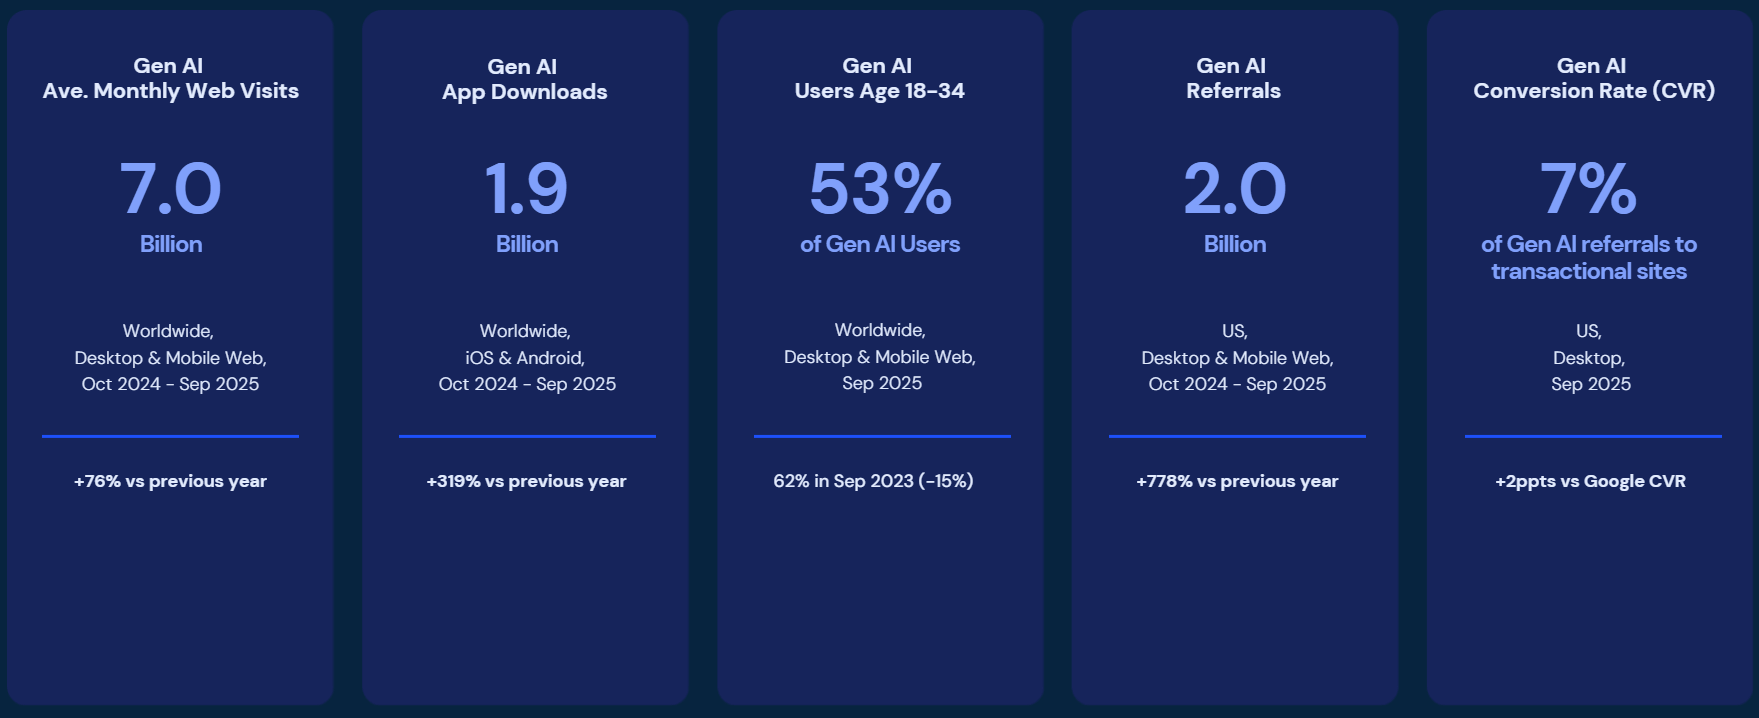
The question isn’t whether to invest in AI visibility optimization. The question is how much is that visibility actually worth?
After extensive research, analysis of industry benchmarks, and validation against real AI visibility campaigns, I’ve built a framework that solves this problem. Not perfect, but practical. Not attribution, but valuation. Not performance marketing, but reach pricing.
This is the AI Brand Mention Valuation Model (ABMV). You can view it as a practical model for pricing AI visibility before you invest a dollar in AEO.
Here’s the mental model that led me here, based on many prior years of working in a large advertising agency:
AI brand mentions should be valued like TV commercials or billboards, not like Google Ads.
When Coca-Cola buys a Super Bowl commercial, they’re paying for guaranteed reach. 115 million viewers. That’s it. No clicks, no conversions, just eyeballs.
When your brand appears in ChatGPT responses to 1 million queries, you’re getting something arguably more valuable:
✅ Contextual placement: Appears as an answer, not an interruption
✅ Zero skepticism: No “ad” label triggering dismissal
✅ Recommendation framing: AI is endorsing, not just displaying
✅ High-intent audience: Only shown to people actively asking
This isn’t performance marketing. This is reach-based brand visibility in a premium, trusted context.
And like all advertising inventory, it should be priced upfront based on estimated reach, not after the fact, based on conversions.
Three data points validate this mental model:
Seer Interactive’s 2024 analysis of LLM visibility found that brand search volume (MSV) correlates with AI mentions at 0.18 (“among the strongest correlations we’ve observed”), excluding organic ranking keywords. Separately, Ahrefs’ study of 75,000 brands found that branded search volume correlates with AI Overview visibility at 0.392.
Translation: AI visibility drives brand searches, but tracking which AI mentions led to which search is nearly impossible, exactly like TV advertising.
According to Brainlabs, “AI often influences decisions without generating trackable clicks. Someone asks ChatGPT for recommendations, gets your brand name, then searches for you directly or types your URL. That branded search or direct visit is the downstream signal of AI-driven awareness.”
This time-delayed pattern mirrors traditional awareness advertising rather than performance marketing’s immediate attribution model.
Early adopters tracking AI referral traffic report “conversion rates up to 3x higher than traditional search traffic” because “users arriving via AI recommendations are pre-qualified and arrive with context about your expertise already established.”
Additionally, Yotpo’s benchmarking of 100+ brands found structured review implementations drove “up to a 25% lift in conversion and 3x higher visibility in AI-generated shopping flows.”
The implication: You can’t measure AI visibility ROI using Google Ads attribution. There’s no last-click. No same-session conversion tracking. Instead, you value AI visibility the way traditional media buyers value a Times Square billboard: by reach, context quality, and audience composition, priced upfront and measured by awareness lift and increases in branded search volume.
Now that we got it out of the way, let’s review the framework.
The ABMV model values monthly AI visibility using this formula:
<em><code><span style="color: #339966">Vmonthly = (TAMqueries × VStarget × Af) × (CPMAI ÷ 1,000)</span></code></em>
Let me break down each component:
This is the total monthly queries in your category across all AI platforms. According to Similarweb’s 2025 Generative AI Landscape report, the AI ecosystem now includes:
Conservative total: 40-70 billion global queries monthly
To calculate your TAM, apply category filters:
TAMqueries = 50B × Category% × Subcategory% × Geographic%
50B global queries

× 8% (Technology category)

× 0.4% (CRM software subset)

× 50% (US + Europe geography)

= 8 million queries/month
Category concentration varies significantly. Based on query pattern analysis:
The specificity of your subcategory matters enormously. For example, “Running shoes” can be 0.5% of ecommerce. “Marathon training shoes for overpronators” might be 0.05%. Make sure to check the updated numbers in our reports periodically.
What percentage of category queries should mention your brand?
This is your strategic goal. Think market share, not vanity metrics.
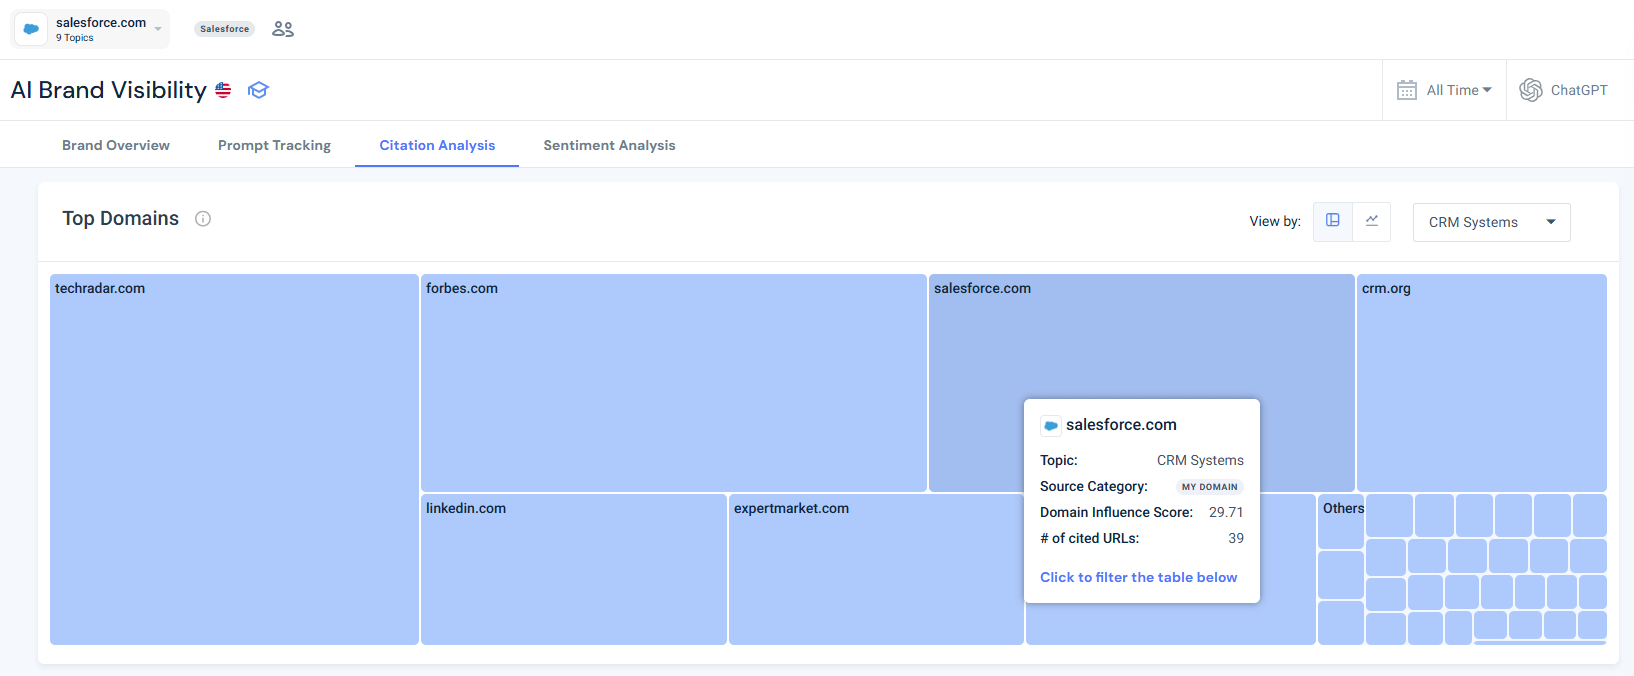
Similarweb’s AI Search Intelligence suite tracks exactly this: “how often and how favorably [brands] are mentioned in chatbot answers.” Our Citation Analysis tool shows which brands dominate AI-generated answers for specific prompts.
| Target Share | Market Position | Examples |
| 80-100% | Category ownership | Salesforce (CRM), Kleenex (tissues) |
| 50-80% | Leader, top 3 brands | HubSpot, Airbnb, Shopify |
| 30-50% | Competitive, established player | Asana, Vrbo, Zendesk |
| 15-30% | Present, known alternative | Monday.com, Booking.com |
| 5-15% | Emerging, new entrant | Startups, niche players |
Setting realistic targets:
If you have 12 competitors and 8% market share, targeting 80% visibility in Year 1 is a fantasy. Target 15-20%.
Growth rates slow as you approach saturation (based on 2024-2025 campaign data):
The Attention Factor measures the quality of your AI mentions, not just the quantity.
Not all mentions are equal. Being mentioned 7th in a list of 10 competitors is different from being the solo recommendation, or the number one brand in a “top x” list.
This is where the model gets sophisticated:
Af = PositionWeight × ContextWeight × SourceWeight × CDW
Let’s understand each of this formula’s separate parts:
Measures where you appear in the AI answer
| Position | Weight | Impact |
| Solo recommendation | 1.5x | “I recommend Salesforce for enterprise CRM.” |
| First in the list | 1.0x | “Top options include: Salesforce, HubSpot, Pipedrive…” |
| 2nd-3rd position | 0.7x | “Consider HubSpot, Salesforce, or Pipedrive.” |
| 4th-6th position | 0.4x | Listed 5th in a list of 8 competitors |
| 7th+ | 0.2x | Mentioned last or buried deep in a long list |
Measures how you’re framed in AI answers (recommended, neutral, or conditional).
How AI platforms describe you matters more than just being mentioned.
| Context | Weight | Example |
| Strong endorsement | 1.5x | “Salesforce is the best choice for enterprise teams.” |
| Neutral mention | 1.0x | “Salesforce is a popular CRM platform.” |
| Qualified/conditional | 0.7x | “Salesforce works well if you have the budget.” |
| With caveats | 0.5x | “Salesforce is powerful, though expensive and complex.” |
| Negative mention | -0.5x | “Salesforce is overpriced compared to alternatives.” |
Using Similarweb’s Brand Sentiment analytics, you can track how brands show up in AI, from sentiment changes over time to relative brand strength against competitors.
See an example of a dashboard for Salesforce brand sentiment below. It’s clear that they are in good shape, with only 1% negative sentiment across all their topics:
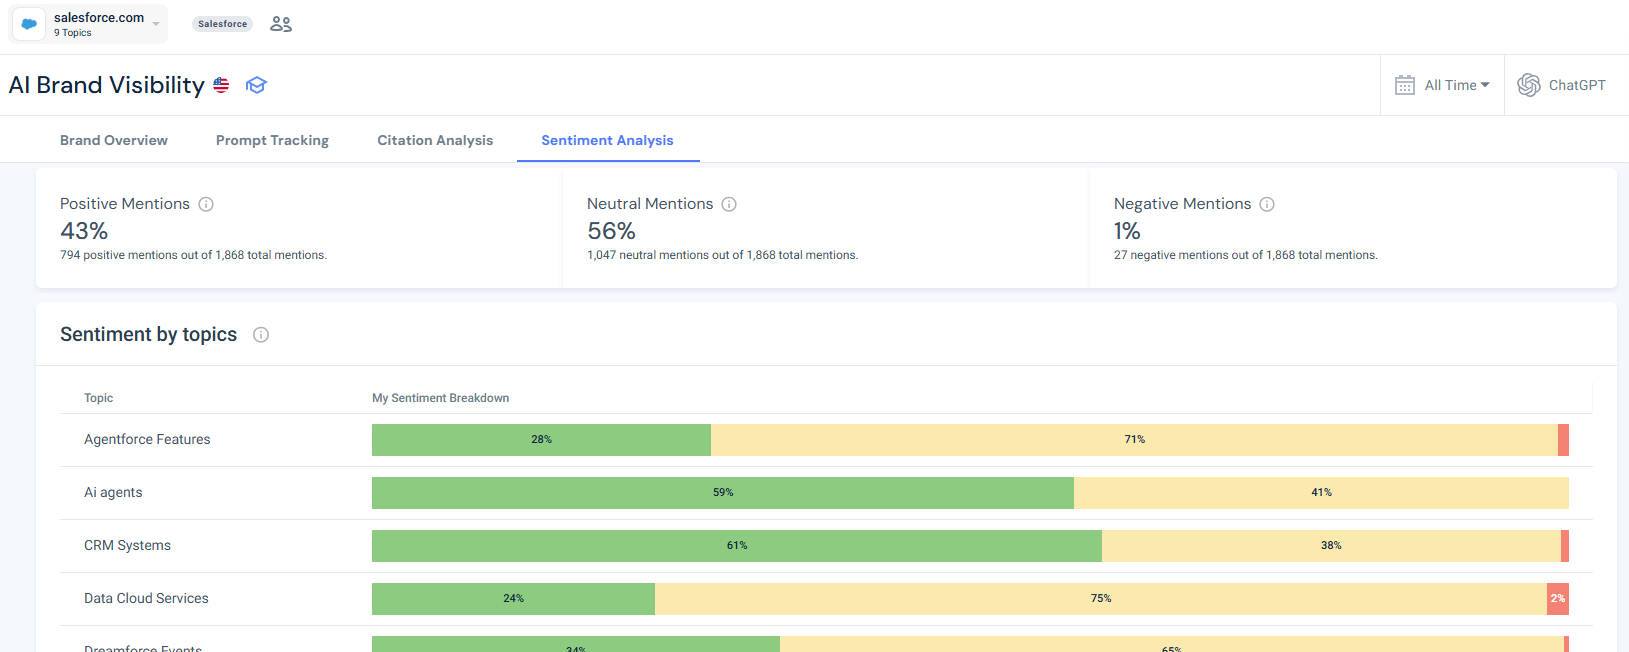
Critical warning: If your average context weight is below 0.7, fix your reputation first. Analyze the prompts and answers in your target topic, and develop a strategy to fix negative sentiment toward your brand.
AI models cite sources. Quality matters. Getting mentioned in a WSJ citation in ChatGPT is worth more than being mentioned without any source attribution. Source quality compounds your visibility value.
Yext research shows that ChatGPT relies heavily on Wikipedia and Reddit, while Gemini relies on YouTube and Wikipedia. Perplexity demonstrates the highest source diversity.
Source Weight measures where the AI platform cites you from.
| Source Quality | Weight |
| Tier 1 authority (NYT, WSJ, .gov, Wikipedia) | 1.3x |
| Industry publication (TechCrunch, HBR, Forbes) | 1.1x |
| Standard source (company website, verified reviews) | 1.0x |
| Low-quality source (forums, unverified) | 0.8x |
| No citation (AI-generated without attribution) | 0.7x |
Measures market saturation effect (how many competitors fight for the same mentions).
This is the most important factor nobody talks about.
AI platforms typically show 3-5 brands per query. If you have 25+ competitors vying for those 3-5 slots, your chances of appearing plummet (even with perfect AEO & GEO execution).
The Competitive Density Weight uses tiered values based on market saturation:
| # of Competitors | CDW Value | Market Type | Impact on Value |
| 1-3 | 1.2 | Oligopoly | +20% value premium |
| 4-6 | 1.0 | Low competition | Baseline (no adjustment) |
| 7-10 | 0.85 | Moderate competition | -15% penalty |
| 11-15 | 0.70 | High competition | -30% penalty |
| 16-25 | 0.55 | Crowded market | -45% penalty |
| 26+ | 0.40 | Saturated market | -60% penalty (floor) |
Calculation examples:
Example impact:
Running shoes (20+ major brands, CDW = 0.55) means even a perfectly executed mention is worth only 55% of baseline value due to market saturation.
Luxury Mediterranean resorts (4-6 major brands, CDW = 1.0) face no density penalty and actually command a 20% premium in oligopoly markets (1-3 competitors).
Premium mention in low competition:
Af = 1.5 (solo) × 1.5 (strong endorsement) × 1.3 (WSJ citation) × 1.2 (3 competitors)


Af = 3.51
Weak mention in a saturated market:
Af = 0.4 (6th in list) × 0.7 (conditional) × 0.7 (no citation) × 0.55 (22 competitors)

Af = 0.11
That’s a 32x difference in value between best-case and worst-case scenarios.
Traditional display advertising CPMs provide our baseline. Then we apply AI-specific premiums:
Premium Multipliers:
However, AI recommendations benefit from an additional “algorithmic authority” premium. BrightEdge analysis found that ChatGPT mentions brands 3.2x more than it cites them, meaning when AI platforms do cite brands, it signals elevated trust.
A University of Melbourne study found that nearly half of people trust AI recommendations, and the format feels like expert guidance rather than advertising.
Conservative trust premium: 2.2x (accounting for editorial-like presentation + algorithmic endorsement effect, while avoiding overstatement)
Combined AI Premium: 3.3x display CPM (2.2 × 1.5)
AI CPM rates vary by industry, depending on customer lifetime value, competitive intensity, and purchase complexity. We calculate AI CPM by applying a 3.3x premium (2.2x trust + 1.5x intent) to industry-standard display advertising rates.
Higher CPMs reflect higher-value customers: Legal services ($99 AI CPM) have client values of $10K-$50K, justifying premium visibility costs. Mass ecommerce ($27 AI CPM) operates on volume with lower margins per transaction.
Use the closest comparable industry if yours isn’t listed.
| Industry | Display CPM | CPMAI (3.3x) |
| B2B SaaS | $20 | $66 |
| Ecommerce (Mass) | $9 | $29 |
| Ecommerce (Luxury) | $15 | $50 |
| Financial Services | $28 | $92 |
| Healthcare | $29 | $96 |
| Travel (Luxury) | $20 | $66 |
| Legal | $33 | $109 |
| Real Estate | $15 | $50 |
Display CPM sources: Gupta Media, Pixis, eMarketer 2025 benchmarks
Note: These rates apply to premium display advertising (LinkedIn and industry publications), not toremnant programmatic inventory.
Let me walk through an example scenario using the model:
Company Profile:
50B global queries/month


× 8% (Technology category)


= 4 billion tech queries


↓


× 0.4% (CRM software subset)


= 16 million CRM queries


↓


× 50% (US + Europe)


= 8 million queries/month
TAM = 8,000,000 queries/month
15 competitors = 6.7% equal share
As an emerging player (8% market share):
Target: 20% visibility share
Why 20%? With 15 competitors, an equal share would be 6.7% each. We have 8% actual market share, but we’re targeting 3x our “fair share” in AI visibility (the established player strategy of punching above your weight).
This is ambitious but achievable: our benchmarks show 20-35% visibility is realistic for established players investing $30-50K/month over 18-24 months, making 20% a strategic Year 2 goal.
This is where we assess mention quality, not just quantity. We audit 50 representative queries to see how we currently show up:
Af = 0.7 × 1.0 × 1.0 × 0.70 = 0.49
This means our mentions are worth ~49% of the theoretical maximum. It’s realistic for an emerging player in a competitive space. As we improve positioning and context, this factor will increase.
We look up our industry in the AI CPM table: B2B SaaS = $66
This represents:
Display CPM baseline: $20 (premium inventory like LinkedIn ads)
× 3.3x AI premium (2.2x trust + 1.5x intent)
= $66 AI CPM
B2B SaaS ($66) is higher than mass ecommerce ($29) because of longer research cycles and higher customer values, but lower than Legal ($109) or Financial Services ($92), which have extremely high client lifetime values and intense competition.
No seasonal adjustments: B2B SaaS demand is relatively stable year-round.
CPMAI = $66
It’s time to combine everything into one formula:
Vmonthly = (8,000,000 × 0.20 × 0.49) × (66 ÷ 1,000)

Vmonthly = 784,000 × 0.06

Vmonthly = $51,744
Breaking it down step by step:
This is the advertising-equivalent value of achieving 20% AI visibility in our category.
Monthly AI Visibility Value: $51,744
Achieving 20% visibility = $51,744/month in reach value.
Competitive density (CDW = 0.70) reduces value by 30% compared with less crowded markets.
Investment scales with competition:
For this CRM example with 12-15 competitors, the realistic investment range is $22-28K/month, yielding an expected ROI of 1.8-2.1x in reach value alone. This excludes click-through value, conversions, and brand lift.
Pure reach valuation justifies the investment at a 2x+ return threshold.
This is defensible to a CMO, CFO, client, or any other stakeholder. Not a guess. A valuation.
Not all AI platforms behave the same. A University of Indiana research analyzing 140,000+ conversations reveals significant differences:
Citation patterns:
If you know your audience skews to specific platforms, apply these adjustments:
Example:
Let’s take a developer tools company with:
Weighted multiplier = (0.60 × 1.0) + (0.20 × 1.15) + (0.10 × 1.25) + (0.10 × 1.0)

↓

= 1.055x

↓

Adjusted monthly value = $51,744 × 1.055 = $54,589
A 5.5% premium for having the right audience on the right platforms.
The model values visibility. But what does it cost to achieve that visibility?
Based on published industry benchmarks:
AEO/GEO Investment Tiers:
| Monthly Budget | Best For | Expected 12-Month Visibility Gain |
| $1,500-$5,000 | Local services, emerging brands | +3-8 percentage points |
| $5,000-$15,000 | Established SMBs, regional focus | +8-15 percentage points |
| $15,000-$30,000 | National brands, competitive categories | +12-22 percentage points |
| $30,000-$50,000+ | Enterprises, dominant strategy | +20-35 percentage points |
This is a recommended breakdown of your AI Search Optimization budget. I separated “Authority building” and “Review & Reputation” since they don’t translate to “backlinks” alone.
| Field | Allocation % |
| Content Optimization | 35-40% |
| Authority Building | 25-30% |
| Technical Optimization | 15-20% |
| Review & Reputation | 10-15% |
| Tools & Monitoring | 10-15% |
Each field includes different actions and tools (many of which would already be covered by traditional SEO in most organizations) that need budget and resource coverage:
For a full guide on this topic, read my post about “How to adapt your SEO budget for AI Search”.
Using First Page Sage’s GEO CAC study, we can calculate CPPP by industry:
| Industry | Investment per % Point |
| B2B SaaS | $800-$1,500 |
| Ecommerce (Mass) | $1,200-$2,500 |
| Financial Services | $1,500-$3,000 |
| Legal (Local) | $400-$800 |
| Travel (Luxury) | $500-$1,000 |
Example calculation: CRM company:
ROI Validation:
This excludes click-through value, conversions, and brand lift. Pure reach valuation justifies the investment.
Before you start, we need to be very clear about the scope of this evaluation model:
✅ What ABMV models:
❌ What ABMV does NOT include:
This is a reach valuation, not performance attribution. Think TV commercial pricing, not Google Ads CPA.
Focus areas by AEO & GEO best practices:
Expected timeline:
Primary KPIs:
Secondary (Validation) KPIs:
Use Similarweb’s Citation Analysis tool to track which content sources and brands dominate AI-generated answers for the topics and prompts that matter most to your business, and use it yourself to gain market share in AI engines.
Note: Apply seasonal adjustments only after calculating your baseline monthly value. This is an advanced multiplier for categories with significant demand fluctuations.
Many categories see 2-5x swings in query volume across seasons. If your category experiences more than 2x seasonal variation, adjust your monthly valuations and budget allocations accordingly.
How to apply:
Retail example: Winter Apparel (2025 benchmarks)
If your baseline monthly value is $80,000 (calculated at average query volume):
Strategic implication: Don’t spread budget evenly across the year. Concentrate 60-75% of your annual AEO investment during peak query periods (typically 3-4 months). Front-load content optimization and authority-building 90 days before peak season to ensure AI models have indexed your improvements.
When NOT to apply seasonal adjustments:
At Similarweb, we trust our data and eat our own dog food. Our AI Search Intelligence suite tracks exactly what this model measures:
Here’s a glimpse from one of our dashboards. It shows AI visibility and brand-mention share, a topical breakdown, competitors, and more:
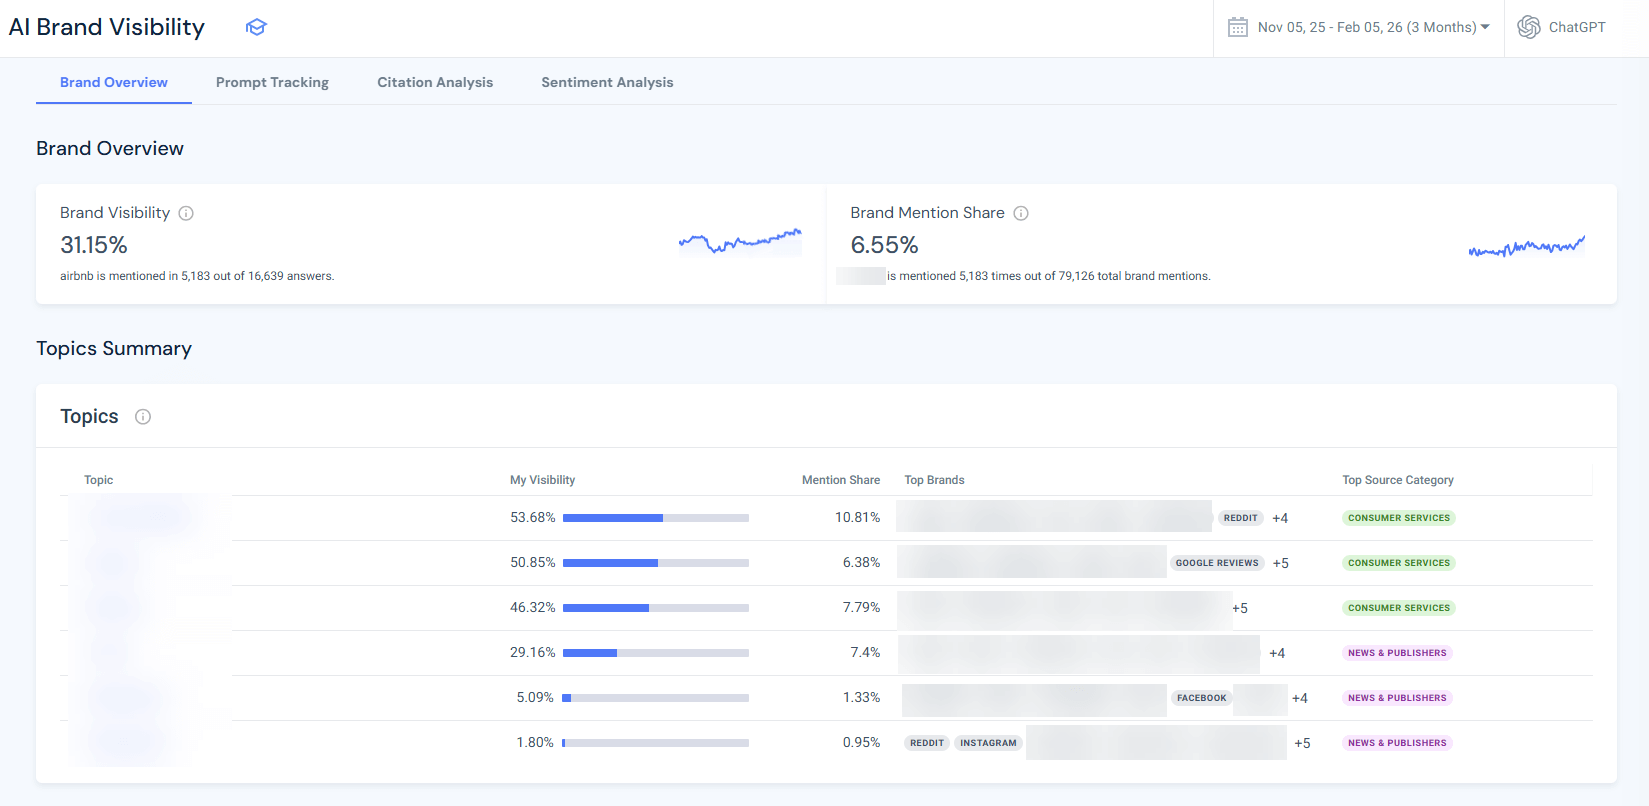
Having all the metrics presented in one place, with a topical breakdown over time, is extremely useful. Using this dashboard, my team and I analyzed our performance across AI engines (Similarweb tracks AI Mode, Perplexity, and Gemini as well) and created a strategy and roadmap to increase our visibility in each.
The ABMV model provides the planning framework. Similarweb’s AI Search Intelligence provides our measurement reality check.
SEO taught us that “ranking #1” was the goal. That metaphor doesn’t work in AI.
There is no ranking #1. There’s only one question: Are you in the conversation?
Similarweb data from Q4 2025 shows 95% of ChatGPT users also use Google. “AI isn’t replacing search, it’s expanding what discovery means.”
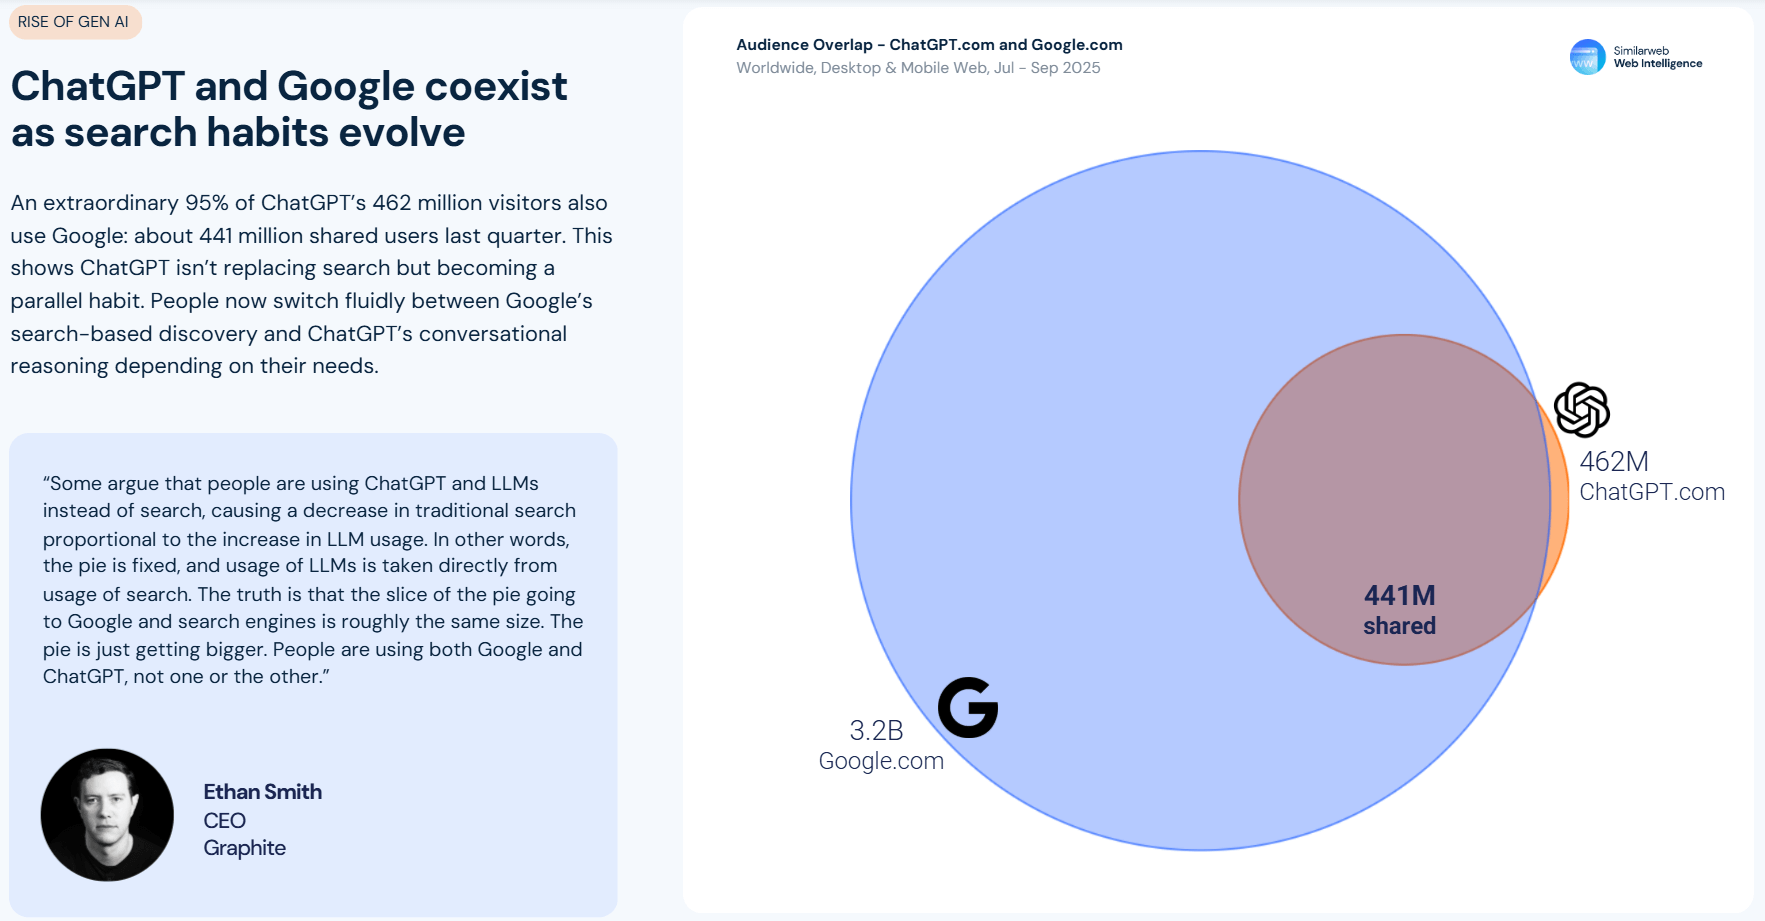
The brands that win will be visible everywhere:
GEO and AEO are not “instead of SEO.” They’re in addition to SEO.
The ABMV model helps you price that additional visibility investment. As Similarweb’s research shows, AI discovery is no longer optional: it’s 7 billion monthly visits, growing 76% YoY, with referral traffic converting at rates that match or exceed those oftraditional channels.
Good news! I’ve built a Google Sheets ABMV & ROI calculator that does the math for you.
Enter your industry, competitor count, and visibility targets, and it calculates your monthly AI visibility value, recommended investment, expected ROI, and timeline in under 10 minutes.
Access The ABMV & ROI Calculator
The calculator includes six integrated tabs designed to handle everything from basic valuation to advanced scenario planning:
Select your industry from the dropdown or enter custom values if your category isn’t listed. The calculator automatically populates:
Here, you need to enter two critical inputs:
The calculator automatically applies the Competitive Density Weight (CDW). Markets with 15+ competitors get penalized (lower value per mention). Oligopolies with 3-6 competitors get a premium.
Rate the typical quality of your AI mentions across three dimensions:
The calculator multiplies these factors to give you an Attention Factor (Af) between 0.1 (worst case) and 3.5 (best case).
The calculator outputs six key numbers:
Make a copy of the template and customize it with your data. Use it as your living budgeting tool, and update it quarterly as your visibility improves and market conditions change.
Access The ABMV &ROI Calculator
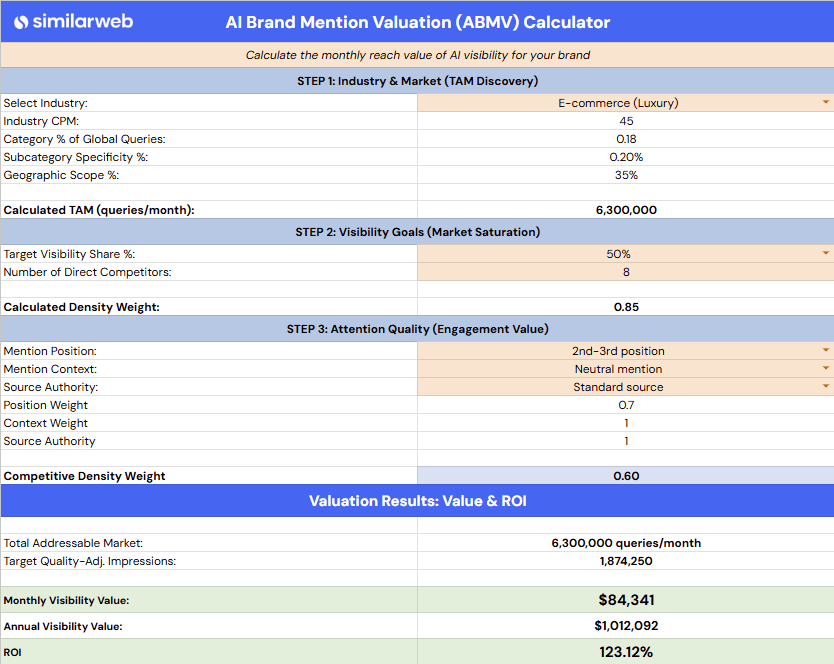
Note: The calculator uses Similarweb’s Q4 2025 benchmark data. Update your copy quarterly with the latest query volumes and market share data from our Generative AI Landscape reports to maintain accuracy.
This model isn’t perfect. AI platforms are black boxes. Query volumes are estimates. CPM benchmarks vary. Attention factors are directional.
But it’s better than guessing.
Better than “let’s try $10K/month and see what happens.”
Better than “our competitor is doing it, so we should too.”
It’s a defensible, data-driven framework for pricing AI visibility before you spend a dollar.
At Similarweb, we’re using this model to guide our AI Search Optimization strategy. We’re tracking visibility with our own AI Search Intelligence tools. We’re validating with traffic and conversion data.
The model isn’t perfect, but it gives us a starting point based on reason, not hype.
That’s what every CFO wants. That’s what every CMO needs.
Now you have it too.
Copy The ABMV & ROI Calculator
What is the ABMV model?
The AI Brand Mention Valuation Model (ABMV) calculates the monetary value of brand visibility across AI platforms using the formula Vmonthly = (TAMqueries × VStarget × Af) × (CPMAI ÷ 1,000). It uses four components: Total Addressable Market queries, Visibility Share target, Attention Factor, and AI CPM pricing.
Why value AI mentions like advertising instead of SEO?
AI mentions behave like reach-based advertising because direct attribution is nearly impossible (like TV ads), conversion patterns are delayed (“research now, buy later”), and AI referral traffic converts higher than traditional search. You’re paying for guaranteed reach in a premium context, not trackable clicks.
How much does AI visibility cost?
Expect to invest $15,000-$30,000 per month for 12 months to achieve a 5-15% share of visibility. Budget breakdown: 40% content optimization, 30% authority building, 20% technical implementation, 10% tools. Moving from 15% to 35% visibility requires $30K-$50K/month for 18-24 months.
What’s the typical ROI timeline?
Most organizations see positive ROI within 10-12 months. Progression: Months 1-3 (foundation, -20% to +5% visibility), Months 4-6 (acceleration, +5-12%), Months 7-9 (growth, +10-18%), Months 10-12 (maturity, +15-25%, ROI positive).
Can I do GEO with a smaller budget?
Yes. At $5K-$10K/month, expect 3-8% visibility share over 18 months in moderately competitive markets. Focus 60% on high-leverage content, 30% on strategic authority building, 10% on basic technical optimization. Better to dominate a niche subcategory than be invisible across a broad market.
How do I measure my current AI visibility?
Track mention rate (were you mentioned?), position (1st vs 7th in list), context (recommended vs conditional), and competitor count. Calculate visibility share: (your mentions ÷ total queries) × 100. Use Similarweb’s AI Search Intelligence to automate tracking at scale.
What’s a realistic visibility target for Year 1?
Depends on starting position: New entrants (0-5%) should target 5-15% with $15K-$30K/month. Established players (10-20%) should target 20-35%, with $30K-$50K/month. Market leaders (25-40%) should target 40-60% with $50K+/month. Growth slows dramatically as you approach saturation, 50% to 70% is exponentially harder than 5% to 15%.
Which AI platforms matter most?
As of Q4 2025: ChatGPT (40-50B monthly queries, 80% market share) is priority #1. Gemini (6-7B queries, 13-14% share) is #2. Perplexity (780M-1B queries, 6.4% share) is #3 for citation quality. Claude (1.9-2.4B queries, 3.8% share) is a bonus. Optimize primarily for ChatGPT to capture 80% of the impact.
How does competitive density affect my AI visibility value?
AI platforms show 3-5 brands per query. With 25+ competitors fighting for those slots, even perfect optimization loses value. The formula CDW = 1.2 – [0.035 × (competitors – 3)], with a minimum of 0.40 value.
What if I’m in a crowded market with 20+ competitors?
Three options:
Can’t I just track AI referral traffic instead of measuring visibility?
No, because attribution is broken. When someone asks ChatGPT for recommendations, then searches your brand directly or types your URL, that shows as branded/direct traffic, not an AI referral. The “research now, buy later” delay (days or weeks) makes tracking impossible.
Measure visibility share proactively and validate with secondary signals such as branded search volume trends and AI referral conversion rates (should be 2-3x higher than average).
Won’t AI algorithm changes make this effort worthless?
Partial risk, but overblown. By optimizing for fundamental quality signals (authority, recency, structure), you’re algorithm-resilient. Google changed 500+ times over the past decade, and sites that optimized for quality survived, while keyword-stuffing sites died. The same principle applies here.
Is this actually driving revenue or just another marketing buzzword?
Driving revenue, but early. As of Q4 2025, Similarweb data show 7B monthly AI platform visits (+76% YoY). Referrals from generative AI to transactional sites grew 357% YoY. AI referral traffic converts at ~7% (matching traditional search), with conversion quality up to 3x higher. Brand search correlates with AI mentions at 0.18-0.39. Direct attribution is murky (like TV ads), but visibility → awareness → revenue correlation is validated.
Do I need expensive tools to implement the ABMV model?
No, you can use the Similarweb AI Search Intelligence suite for $99 to automate tracking in AI engines for 500+ queries, with competitor benchmarking. If you’re spending $15K-$30K/month on optimization, spending $1-3K/year on measurement (10% of your tools budget) using the most accurate datasets in the world is worth it.
Can I use the ABMV model for platforms beyond ChatGPT/Gemini?
Yes, with modifications. The four-component framework (TAM × visibility share × attention × CPM) works for voice assistants, social search, and emerging platforms. Adjust TAM calculation method, attention factor weights, and CPM benchmarks by platform, but the logic holds: Calculate addressable queries × your share × attention quality × cost per thousand.
How does the ABMV model work for international markets outside the US?
Adjust TAM by geography and platform mix. While ChatGPT dominates globally (~80%), regional platforms matter: Baidu’s ERNIE (China), Naver’s HyperCLOVA (Korea), Yandex’s YaLM (Russia).
Calculate TAM separately per region, apply local CPM rates (typically 30-50% lower outside the US/Europe), and weight visibility by platform usage. For global brands, sum regional values: Vglobal = VUS + VEurope + VAsia + VLatAm.
Should I adjust my ABMV calculation for seasonal demand fluctuations?
Yes, if your category sees >2x seasonal variation. Calculate baseline monthly value using average query volume, then apply seasonal multipliers. Example: Winter apparel might be $32K/month in Q2 (0.4x) but $264K/month in Q4 (3.3x). Redistribute the annual budget to concentrate 60-75% during peak periods, and front-load optimization 90 days before peak season.
Does ABMV work differently for B2B vs B2C brands?
Yes. B2B: Lower TAM (smaller query volume) but higher CPM ($25-$80 vs $8-$35 for B2C). Position Weight matters more, and a solo recommendation carries 3-5x value. Target 15-30% visibility. B2C: Higher TAM, lower CPM, but Competitive Density hits harder (more brands competing). Need 25-40%+ visibility for meaningful impact.
When should I change my AI visibility strategy or admit it’s not working?
Review at 6 months. Pivot if: >20 competitors and <5% visibility after 9 months, shift to narrower subcategory.
Red flags:
Beyond visibility share, what metrics can help verify the accuracy of the ABMV model?
Track correlation metrics quarterly:
If visibility grows but these don’t translate into business impact, you’re gaining mentions without business impact.
Director of SEO & AI Search at Similarweb
Limor brings 20 years of expertise in SEO and AI Search. She thrives on solving complex problems, creating scalable strategies, and building amazing dashboards.
Give it a try or talk to our insights team — don’t worry, it’s free!