
What is RAG (Retrieval-Augmented Generation)? A Marketer's Guide
by Shai Belinsky9 Min.
Oct 01, 2026
Search behavior has shifted dramatically. Traditional SEO metrics like rankings and organic traffic still matter, but zero‑click searches now account for roughly 69% of Google queries. To top that, AI summaries now appear in about 18% of searches and often cite three or more sources.
When people get a complete answer from an AI engine without clicking a link, the only way your brand is visible is if you are in the answer. That’s where Generative Engine Optimization (GEO) comes in: the discipline of making your brand the easiest, most trustworthy source for AI systems to cite.
As an SEO director at a SaaS company, I report on my brand’s organic performance and the SEO team’s activities to stakeholders. Lately, I’ve learned that GEO requires us to add new key performance indicators (KPIs) to our reporting mix.
In this article, I’ll explain which KPIs matter for GEO, and how to measure them using both qualitative best practices and data from Similarweb’s AI Search Optimization Suite. I’ll show why they’re essential for modern search success, and wherever possible, I’ll give real-data examples and hands-on recommendations.
GEO KPIs shift the focus from keyword ranks and page clicks to measuring how often your brand and content appear in AI‑generated answers, and are trusted by generative models and incorporated into their answers. Rather than traditional metrics, you measure the frequency and quality of citations and authority signals within generative answers.
As Avinash Kaushik notes, answer engines require “answer engine analytics (AEA)”: new success metrics such as brand visibility and citation frequency.
Rankings, website traffic, and click‑through rates become less relevant. To measure our GEO & AEO performance, we must track our visibility, domain influence, and the frequency with which our brand is mentioned and cited in AI responses.
The way we measure success changes according to the relevant channel. GEO, AEO, and SEO are complementary, but they focus on different parts of the search landscape.
This table details the key KPIs and metrics for each:
| GEO KPIs | AEO KPIs | SEO KPIs |
|
|
|
When we know which metrics and KPIs belong to each of these channels, we can better measure our own initiatives in optimizing them.
Now, it’s time to drill down into the core GEO KPI’s.
Below, I’ll outline the key metrics every SEO should monitor for GEO. I’ll describe each KPI and then show how to measure it using an AI Brand Visibility campaign for Hootsuite (Nov 16-Dec 16, 2025) to illustrate how the metrics are calculated and why they matter.
This KPI measures how often your brand is mentioned in AI‑generated answers relative to all answers in the chosen timeframe. It tells you if AI engines consider your brand relevant enough to include in responses.
In the AI Brand Visibility tool, you can see this data right in the overview section. It shows you both the actual number of mentions and AI answers, as well as the percentage of your brand mentioned out of the total number of answers. This is your visibility score.
This percentage is the primary visibility KPI. A lower number indicates either a lack of content relevant to the model’s prompts or insufficient authority, and a high number means that AI engines frequently use your brand to answer queries.
If your brand visibility is low, you’re effectively invisible in AI conversations. Improving AI visibility KPIs involves creating answer‑friendly content, building authority, and earning citations across trusted sources.
While Brand Visibility measures whether your brand appears at all, Brand Mention Share looks at how often your brand is mentioned relative to all brands within AI answers. Think of it as share‑of‑voice for generative answer engines.
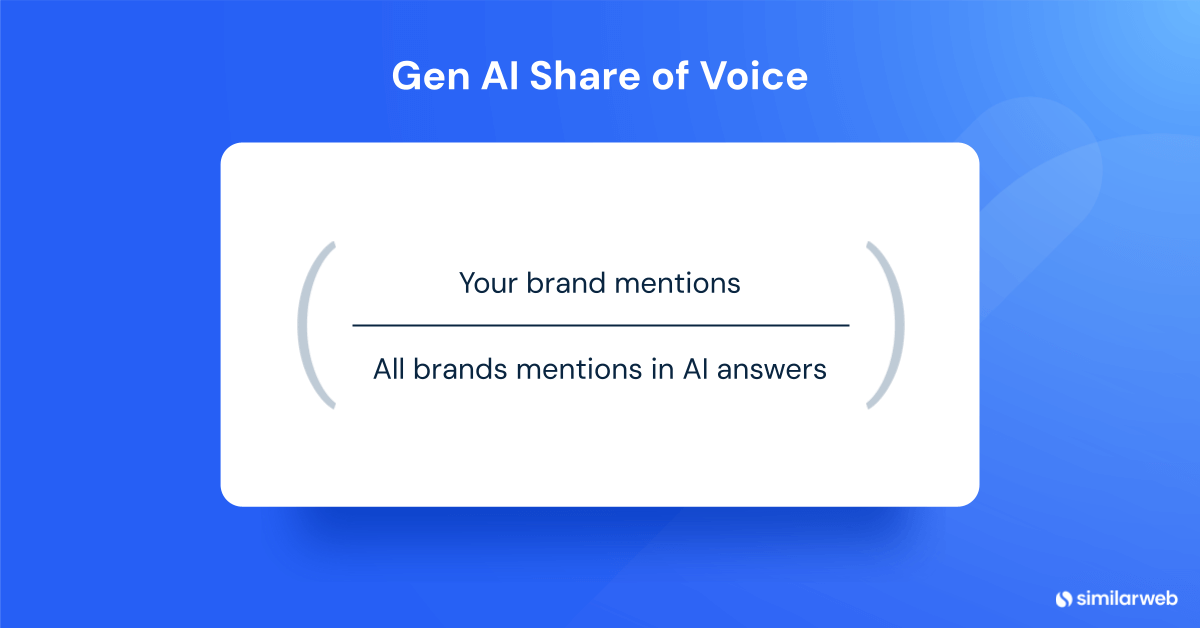
This data appears at the top of the overview section in the AI brand visibility tool, making it easier to track and log. Once you benchmark your AI share of voice, you can take actions to increase it and measure your progress using this metric.
A low brand mention share might be acceptable for a niche brand in a broad market, but tracking changes over time helps gauge competitive momentum.
Share of voice indicates how well your brand competes for attention against direct and indirect competitors. If competitors are gaining mentions faster than you, your authority may be eroding.
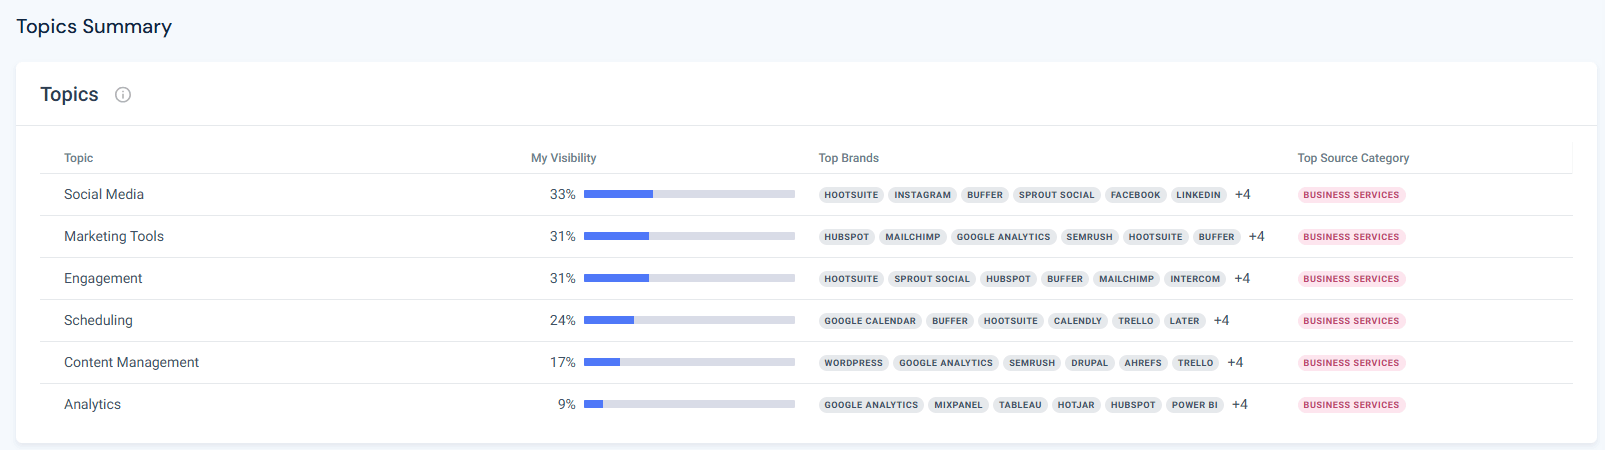
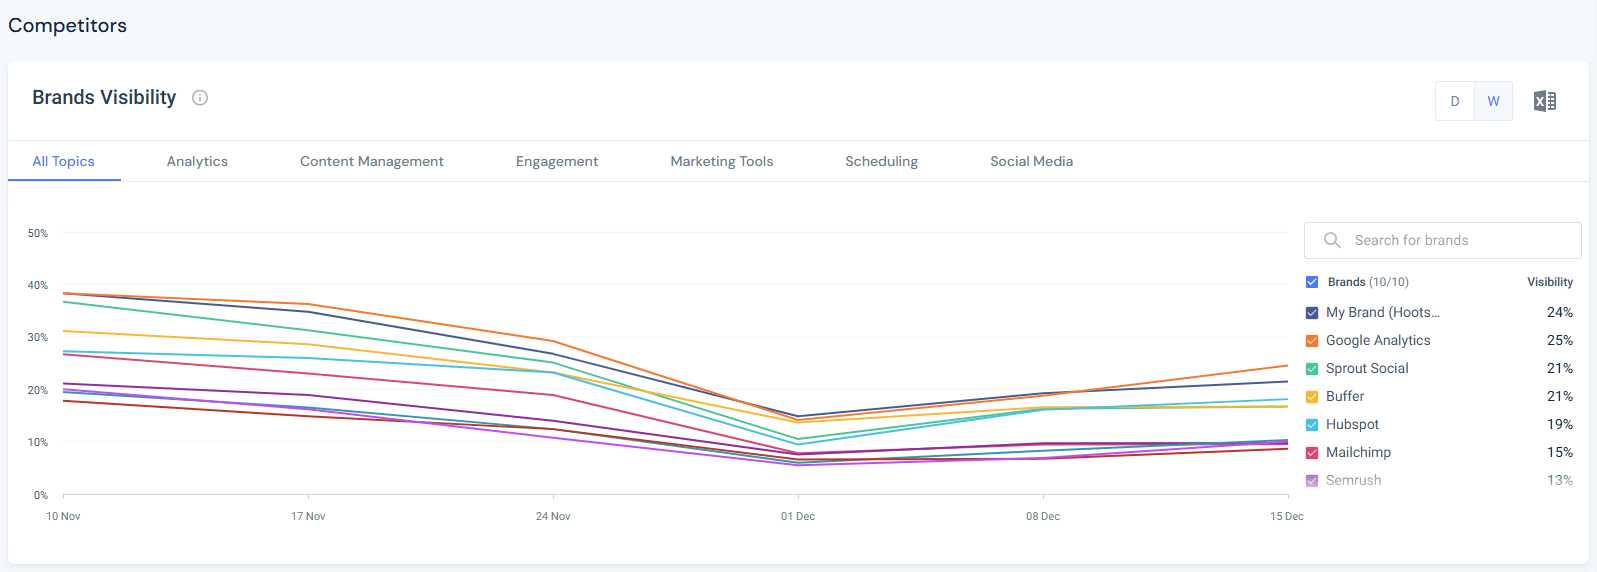
Generative answer engines organize queries into topics. Topical visibility measures your brand’s presence within each topic, while competitor benchmarking compares your visibility with other brands. This KPI helps you understand where you are strong or weak.
In the Topics Summary section, filter for the relevant timeframe (e.g., 1 month). Inspect your visibility per topic and track your growth in each topic vs. the relevant competitor set.
Topic‑level visibility reveals which areas drive your brand’s presence and where you need improvement. It also shows whether you are competing against direct rivals or unexpected players.
If your brand is absent in high‑value topics, that’s a cue to create targeted content or increase off‑site citations in that domain.
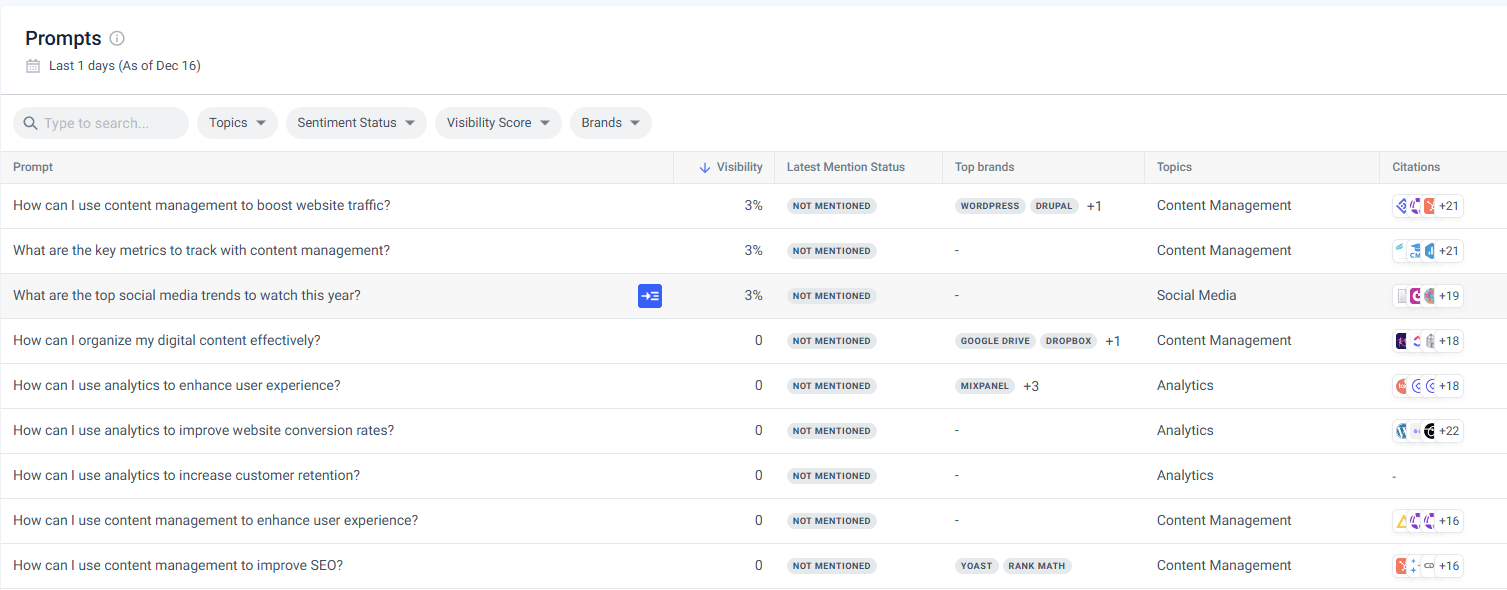
Generative answer engines decompose user queries into many prompts. Prompt‑level visibility measures how often your brand appears in responses to specific questions. A prompt gap analysis identifies prompts where your brand is absent or underrepresented.
The Prompt Analysis tool lists individual prompts, their visibility percentage, and whether the brand is mentioned.
By grouping prompts by topic and intent, you can uncover gaps. If your brand is absent in a prompt, adding content that answers that exact question can improve visibility.
According to query‑fan‑out principles, generative answer engines break complex questions into multiple sub‑queries. If you aren’t optimized for those sub‑queries, your content won’t be retrieved or cited.
Prompt‑level analysis lets you prioritize questions to answer and ensures your brand becomes part of the AI’s “knowledge base.”
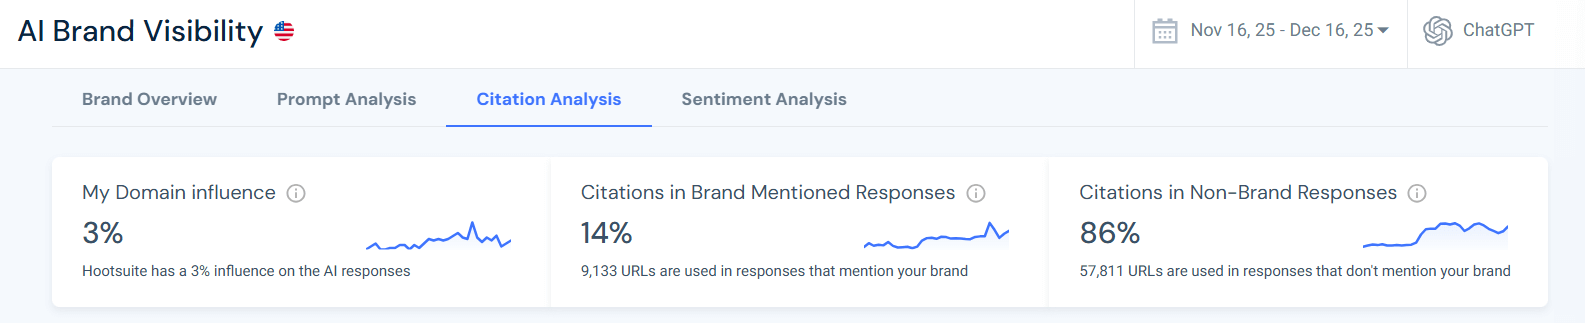
Domain Influence score measures how often your domain is cited relative to all domains used in AI answers. The Citation Share metric distinguishes between citations in answers that mention your brand and those that don’t. These metrics show whether your content is considered a trusted source.
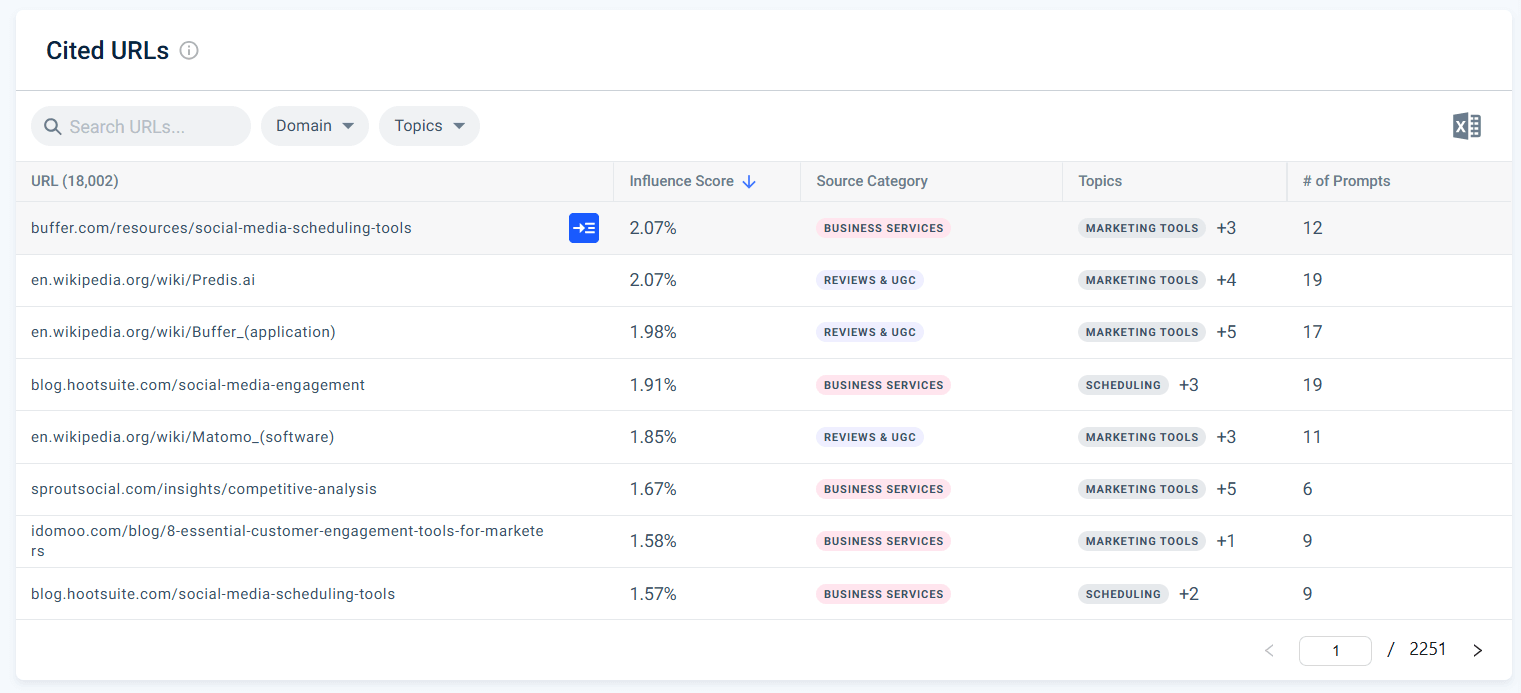
In the Citation Analysis tool, record the data from the overview section. Review the influence trend to make sure you’re steadily growing. Digging into the Top Cited URLs list reveals which specific pages drive influence.
A high domain influence score means AI engines trust your site. A low score signals that your own content is seldom used as evidence, even when your brand is mentioned. Improving this KPI requires publishing authoritative resources, earning backlinks, and ensuring your pages are machine‑readable.
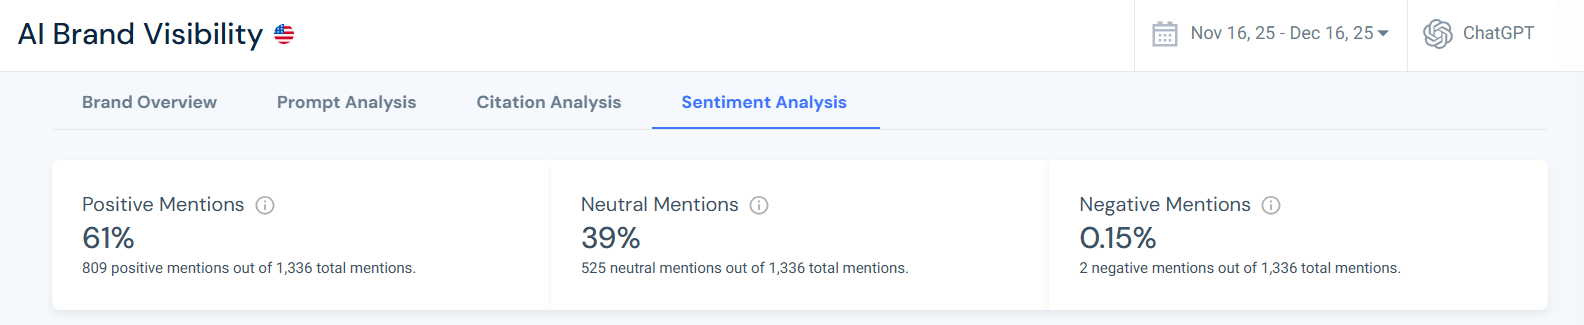
The sentiment analysis process categorizes brand mentions as positive, neutral, or negative. This KPI indicates how AI engines perceive your brand and how they position it in answers.
The Sentiment Analysis tool shows you this data from top to bottom. First, review the overall sentiment scores and record your positive, neutral, and negative shares.
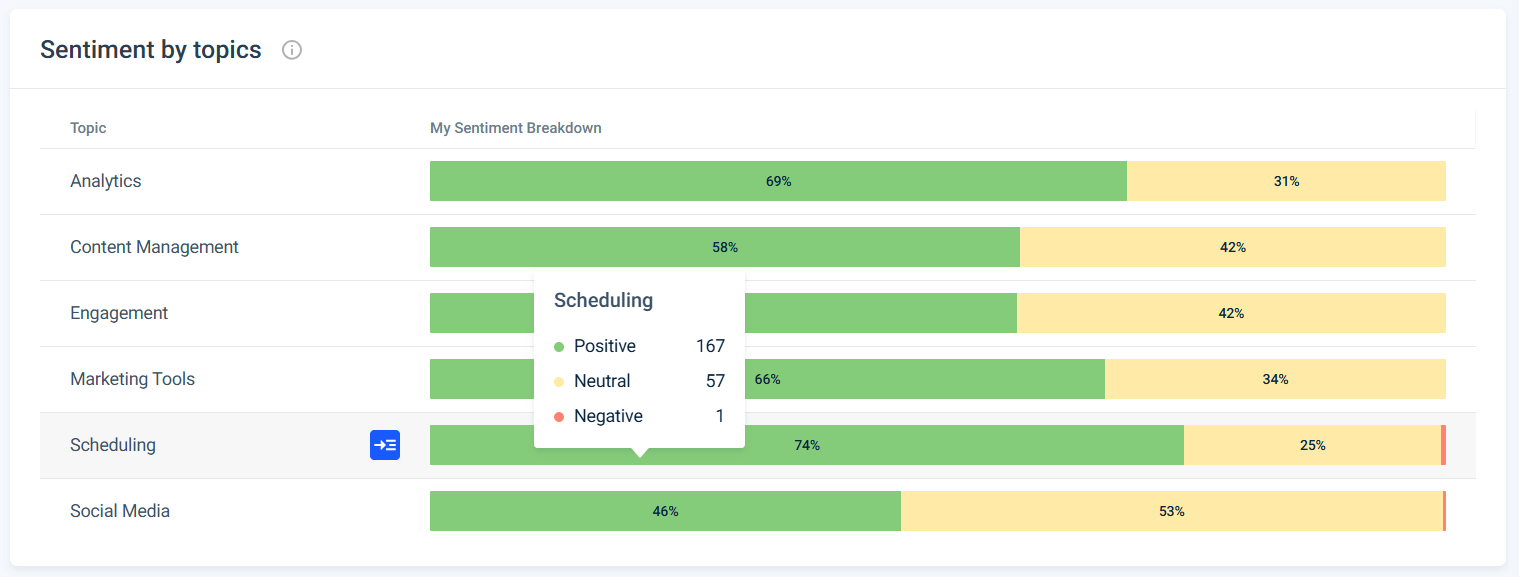
Then scroll down to see sentiment by topic. This chart breaks down your overall sentiment score by the topic you’re tracking, showing you if you have issues around specific topics or intent.
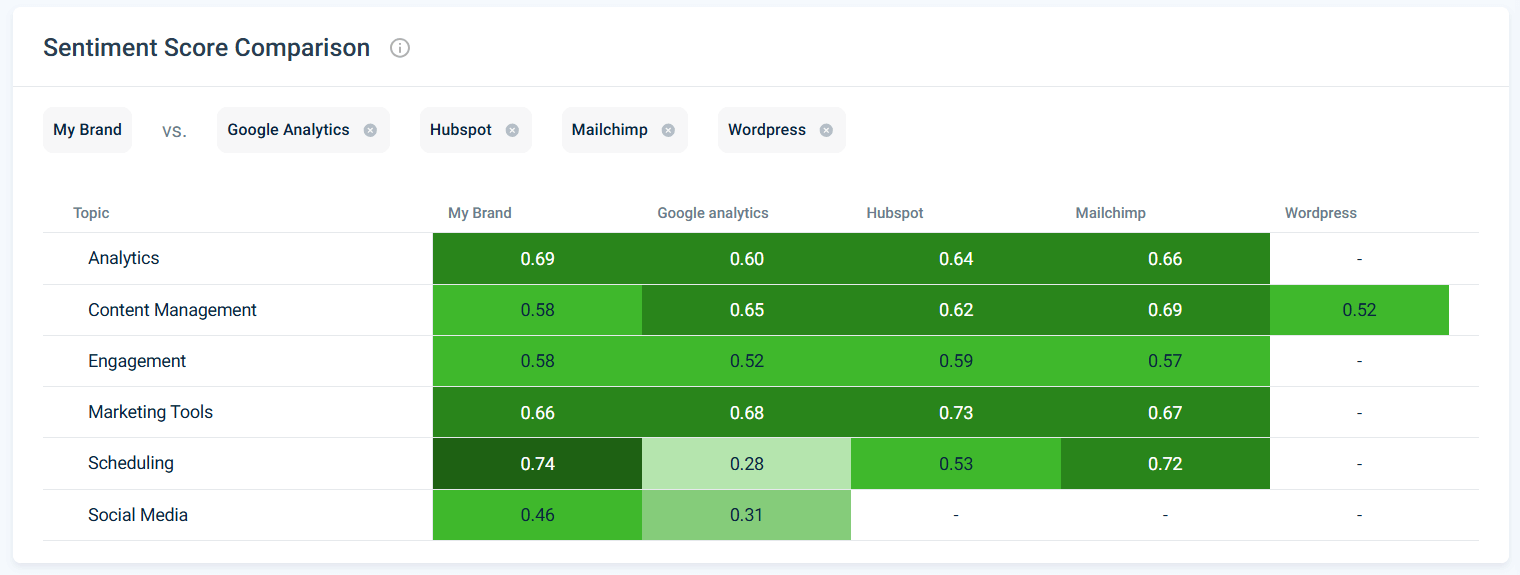
Next, scroll down to the competitors’ chart and compare your sentiment scores with competitors to see where you lead or lag. The chart shows you how you measure in each topic vs your competitors, who has the most positive sentiment, and who’s entirely out of the conversation.
Positive sentiment enhances trust and increases the likelihood of being cited. If a topic has high negative sentiment, you should inspect what’s causing it. The AI visibility tool lets you see each prompt and answer, helping you zoom in on the reason for any negative sentiment.
Once you understand the reasons, you can address the sentiment for your brand if it isn’t positive. You may need to update content, address customer concerns, or improve product features to shift the narrative.
The AI traffic tool measures the volume of visits to your site from AI engines. You can add conversion metrics (like sign‑ups or purchases) to get a broader view of how that traffic performs.
I like measuring it because it grounds the visibility metric into measurable clicks, which is a critical aspect of measuring SEO, AEO, and GEO success.
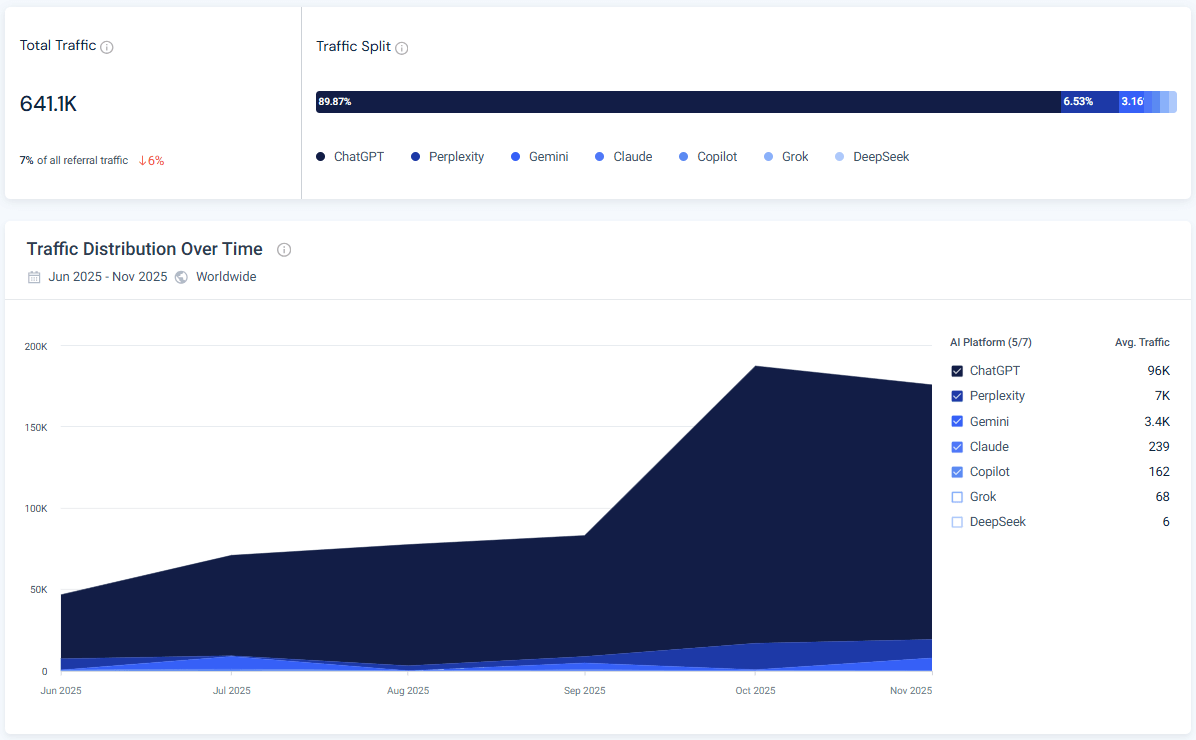
AI Traffic analytics show the number of visits from each chatbot and the share of total AI traffic. Once you select the domain you need, the tool will show you the relevant data for that domain.
Although AI search traffic is currently small (often under 10%), it converts at high rates because users arrive at your website with strong intent. Tracking conversions helps justify investment in GEO and demonstrates ROI.
To make these KPIs actionable, let’s walk through a step‑by‑step process using the Hootsuite campaign. Each step explains how to extract the metric, why it matters, and what action to take.


Use Similarweb’s AI Traffic Analytics to see which pages are receiving visits from AI engines. Monitor conversion metrics (sign‑ups, purchases) to understand ROI. A small but growing share of traffic comes from generative engines.
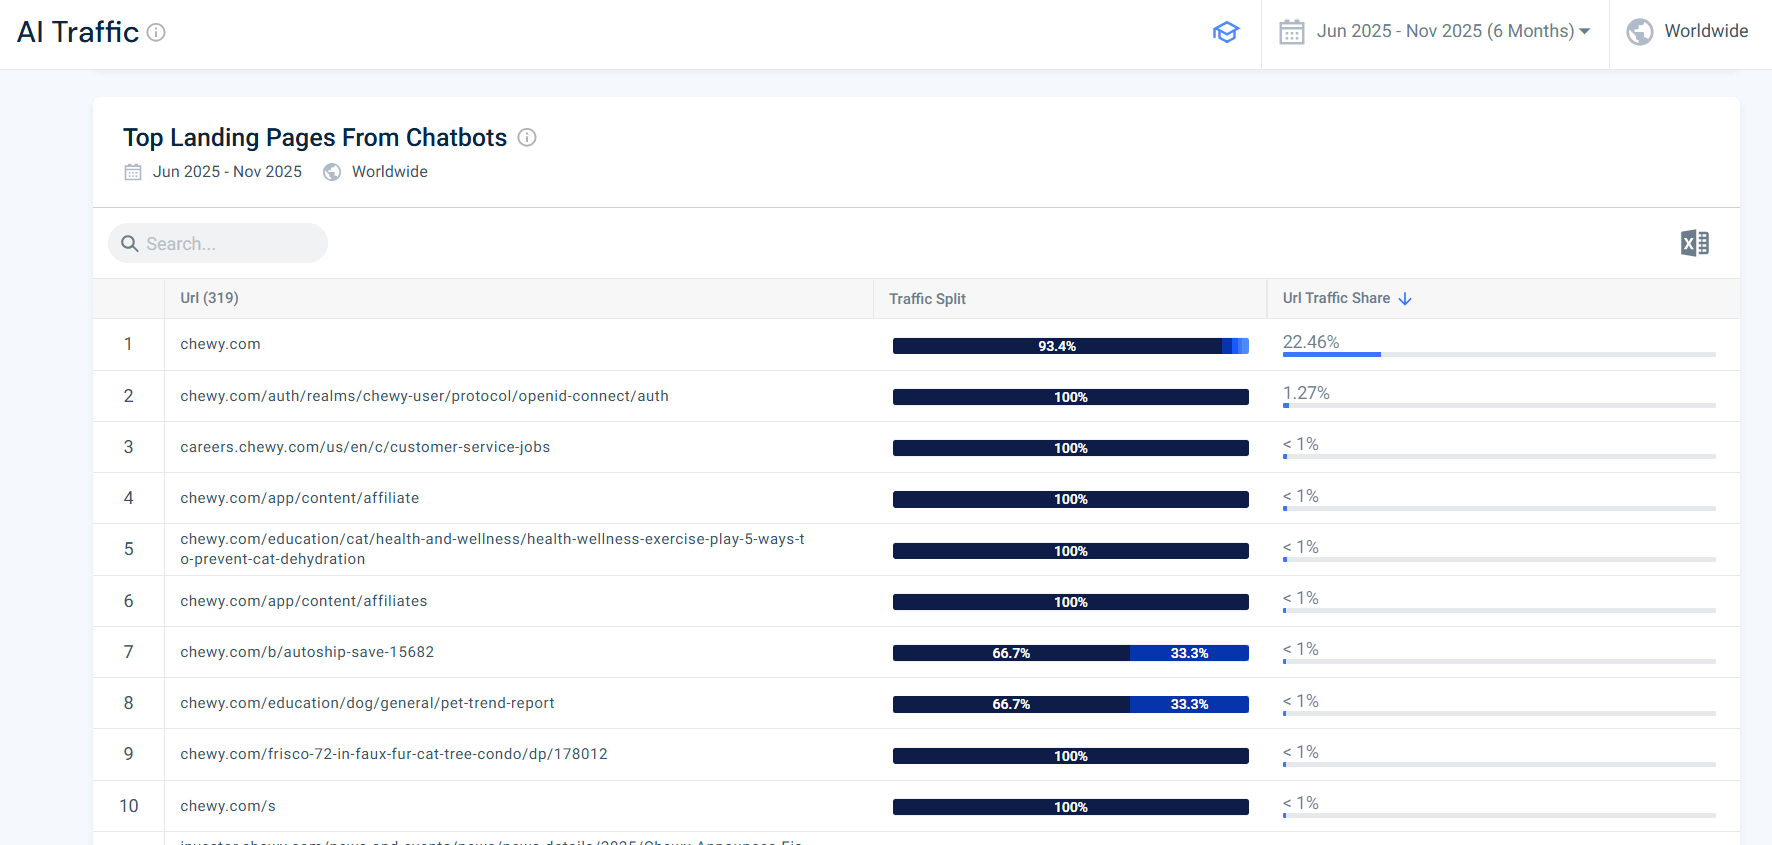
At this stage, you’ve collected your core metrics and walked through each one using Hootsuite as a real‑world example. These KPIs form the backbone of a Generative Engine Optimization dashboard.
To take your analysis further, you can also track engagement metrics and conversions from AI search traffic, though many brands are still exploring how to incorporate this data.
With your benchmarks in hand, it’s time to consolidate your findings into a report that anyone can understand. The following section shows you how to pull these metrics into a simple reporting template.
This streamlined template helps you monitor the performance of your key Generative Engine Optimization metrics. It brings together brand‑level visibility, topic coverage, prompt‑level insights, citation share, sentiment breakdown, and optional AI traffic into a single Google Sheet.
Use it to benchmark your position in AI results, spot gaps, and track progress over time.
Compare each metric with the previous period to track gains or declines and decide whether to boost authority, improve sentiment, or strengthen off‑site signals.
Guidance: When filling out this template, use simple, clear language and base your commentary on real data. Regularly updating this template will help you track progress and stay focused on the GEO KPIs that matter.
Copy the template, fill in your data, and start measuring GEO performance.
Generative AI engines are relatively young, and Generative Engine Optimization is even younger. There are no standards set yet, not for the AI engines and not for measuring their output for GEO.
As you build your GEO strategy, acknowledge these uncertainties and adopt a cautious approach:
GEO KPIs shift the lens from ranking positions to being the answer. It’s about becoming a foundational source for generative AI models to generate comprehensive answers.
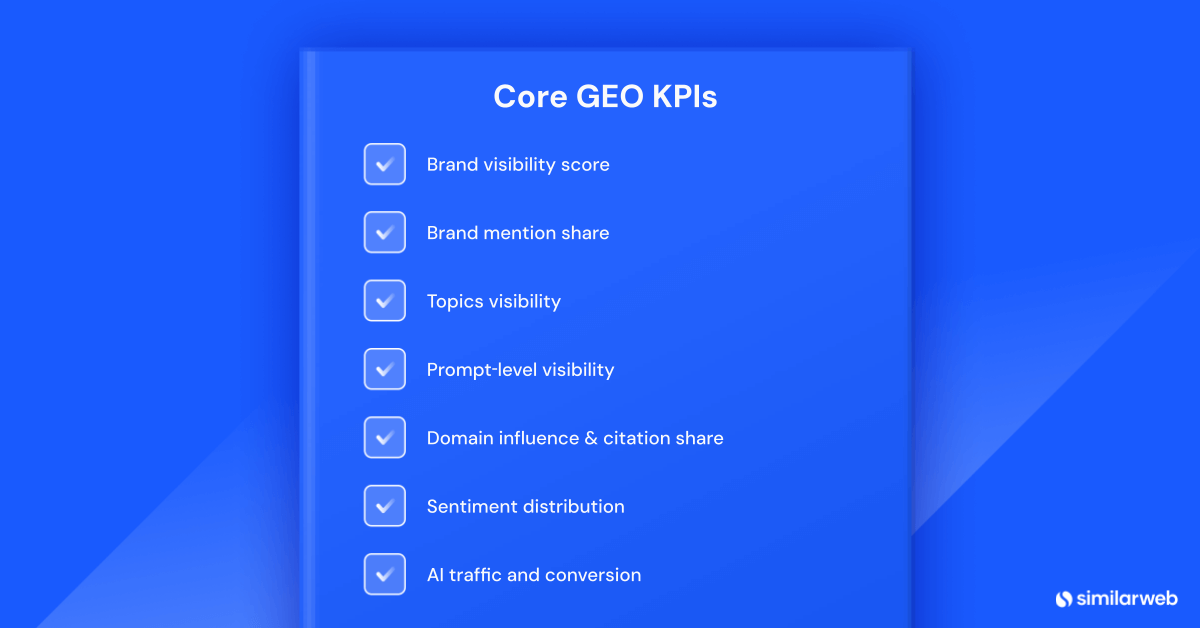
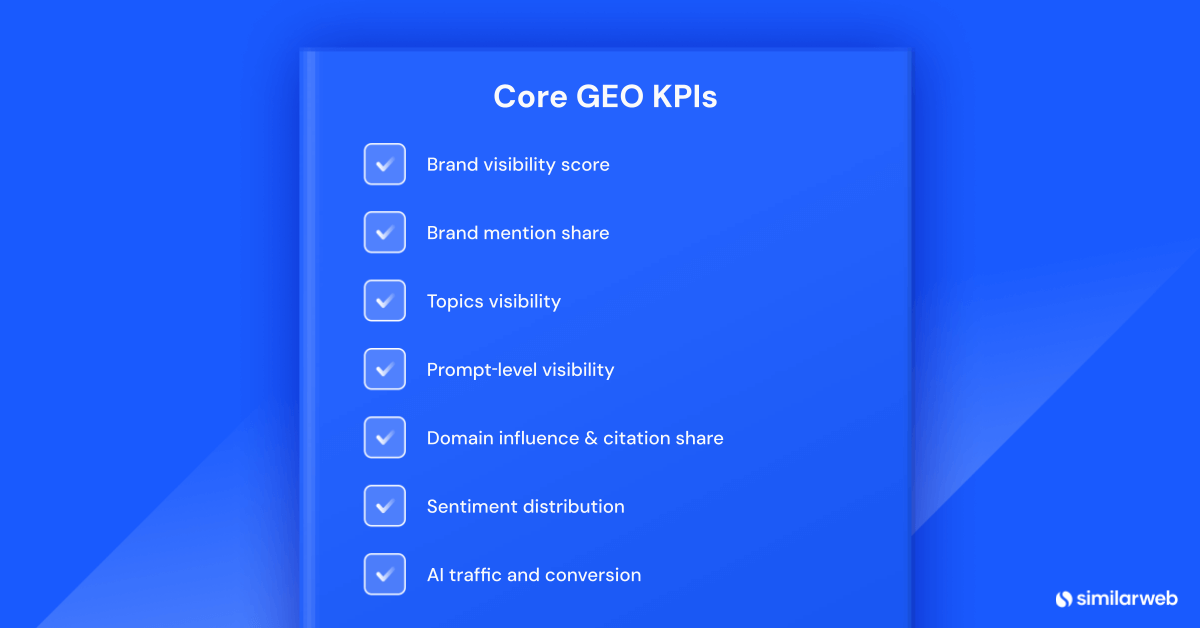
Metrics like Brand Visibility, Brand Mention Share, Topic Visibility, Prompt‑level presence, Domain Influence, Citation share, Sentiment, and AI Traffic give SEOs a complete view of their performance in AI ecosystems. Tracking these KPIs ensures you focus on building trust, authority, and relevance (signals that generative answer engines reward).
Remember that optimizing for Gen AI platforms does not replace SEO, only extends it. You still need technically sound, crawlable pages and strong topical authority. By layering GEO KPIs on top of your existing metrics, you can future‑proof your brand for a world where answers matter more than clicks.
At a minimum, monthly. Many brands run 30‑day campaigns to see short‑term trends and track quarterly to evaluate strategy effectiveness. Adjust the time frame based on your content cadence.
AEO KPIs measure how often your content appears in direct‑answer positions, such as featured snippets, voice‑assistant results, and “People Also Ask” boxes. GEO KPIs focus on generative AI platforms: they track how frequently AI engines mention, cite, and accurately reference your brand, mentions on authoritative domains, and backlinks.
No. Citation patterns vary by engine: a recent study found only 11% overlap in citations between ChatGPT and Perplexity and noted that about 50% of cited domains change each month. Track each model separately and compare results.
Brand Visibility measures the percentage of AI answers that mention your brand, while Brand Mention Share compares your mentions to the total mentions of all brands. Visibility shows presence; share shows competitive strength.
Publish authoritative content, earn high‑quality backlinks, and ensure your pages use structured data. Off‑site assets (e.g., Wikipedia pages) also boost influence.
AI engines prefer to cite brands with positive or neutral sentiment. If your sentiment score is low, address product issues, improve user experience, and update content to present balanced, factual information.
Yes. Although AI‑derived traffic is still small, it often comes from users with strong intent and converts at higher rates than typical organic traffic. Monitoring AI traffic helps you quantify the business impact of GEO.
Brand Visibility measures the percentage of AI answers that mention your brand. Brand Mention Share compares your mentions to the total mentions of all brands. Visibility shows presence; share shows competitive strength.
Publish authoritative resources, earn high‑quality backlinks, and ensure your pages use structured data. Off‑site assets like Wikipedia pages or industry guides can also boost influence.
Director of SEO & AI Search at Similarweb
Limor brings 20 years of expertise in SEO and AI Search. She thrives on solving complex problems, creating scalable strategies, and building amazing dashboards.
Give it a try or talk to our insights team — don’t worry, it’s free!