



Dark Funnel Metrics: What to Measure When Buyers Decide Before They Click
by Limor Barenholtz20 Min.
Oct 14, 2026
I’ve spent a lot of time lately staring at dashboards that didn’t exist two years ago. Visibility scores. Mention rates. LLM comparison charts. And every time I show these numbers to a stakeholder, I get the same question: “Is that good?”
That’s the right question, and for a while I didn’t have a clean answer. A score without a benchmark is noise. So I went looking for the benchmark, and what I found makes the question more urgent than most teams realize.
According to Similarweb’s Generative AI Statistics post, 35% of US consumers now use AI tools at the product discovery stage, compared to 13.6% who use traditional search engines (US Market Research Panel, January 2026). At the evaluation and comparison stage, AI holds a 32.9% to 15% advantage over search. That means a significant portion of your potential buyers are forming their shortlist inside an AI-generated answer, before they ever reach a search result. Which makes knowing your AI brand visibility score, and whether it’s actually good, one of the more important things in your marketing stack right now.
This article breaks down what an AI brand visibility score actually measures, how it’s calculated, and what “good” looks like across six industries using real data from Similarweb’s 2026 AI Brand Visibility Index. If you’re reporting on AI visibility to stakeholders and you’re tired of answering “is that good?” with a shrug, this is the reference you need.
An AI brand visibility score is a metric that measures how often your brand appears in AI-generated responses across platforms like ChatGPT, Google AI Mode, and Perplexity. It tracks presence, out of all the relevant prompts users ask in your category, what percentage of those AI-generated answers include your brand, expressed as a percentage.
Think of it as a share of voice, but inside the AI answer layer, not on a search results page.
The fundamental difference from traditional SEO is that LLMs don’t retrieve pages and rank them. They synthesize answers from patterns learned during training and, increasingly, from real-time retrieval. Your content doesn’t need to rank on page one, it needs to be part of how the model understands your category. That’s a different optimization problem, and the visibility score is how we measure whether we’re solving it.
At Similarweb, we calculate AI brand visibility score by giving your brand a score of 1 each time it is mentioned in an AI-generated answer. The final visibility score is your total brand mentions across all LLMs divided by the total number of AI-generated answers tracked across all LLMs, expressed as a percentage:
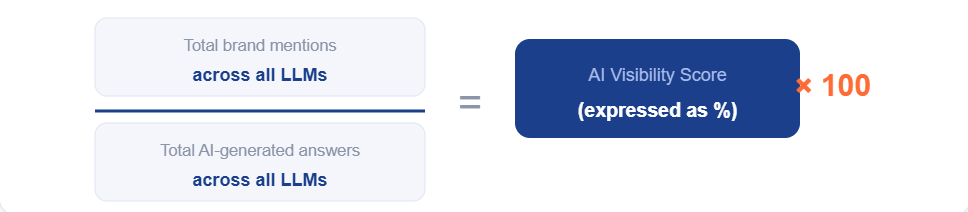
So if your brand is mentioned in 226 out of 1,000 tracked AI answers, your visibility score is 22.6%. This gives you a clear, consistent signal of how often your brand shows up in the AI answers that matter, across ChatGPT, Google AI Mode, Perplexity, and Gemini, for the exact topics and prompts your customers are actually asking.
The number is only as meaningful as the prompt set behind it. A prompt set built around how your customers actually research and discover products in your category will give you a meaningful benchmark. A generic or too-narrow set will produce a number that looks clean but tells you nothing actionable. This is why prompt selection, not the formula itself, is where most teams get measurement wrong.
A good AI brand visibility score depends entirely on your industry and competitive set. Category leaders range from 15.89% in Finance (Chase) to 54.38% in Consumer Electronics (Apple), according to Similarweb’s 2026 AI Brand Visibility Index. There is no universal threshold, context is everything.
The most common mistake is benchmarking against a generic number without accounting for category dynamics. A 10% score in Consumer Electronics, where Apple holds 54%, is a completely different signal from a 10% score in Finance, where it puts you in direct competition with Chase and Fidelity.
Three frames make this actionable. I call them the LCM framework:
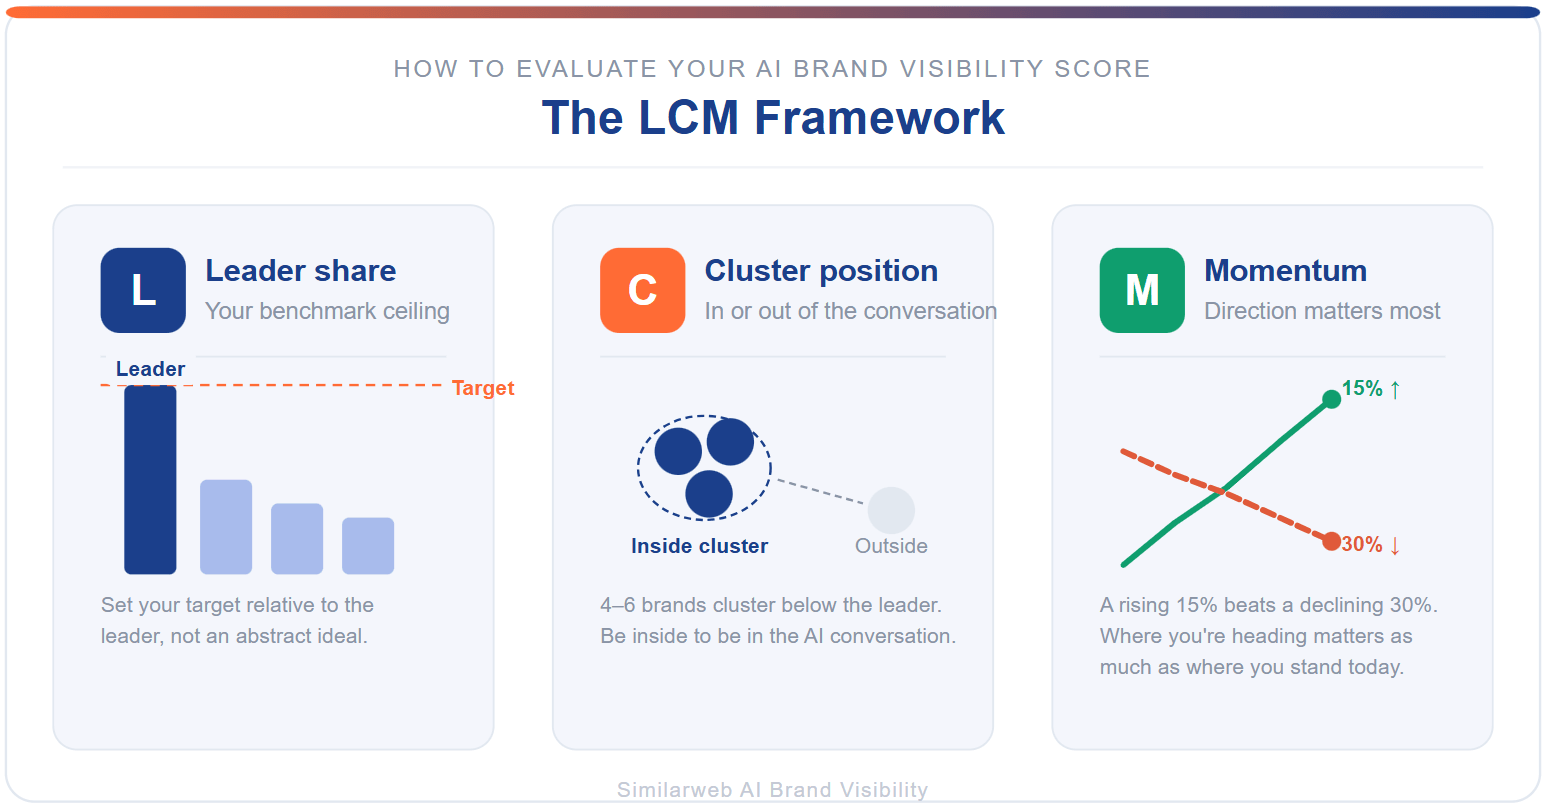
The data below makes all three frames concrete, sector by sector.
The following data comes from Similarweb’s 2026 AI Brand Visibility Index, which tracked brand mentions across six sectors: Finance, Travel, Consumer Electronics, Beauty, Fashion, and News. Totaling more than 25,000 prompts analyzed across ChatGPT, Gemini, Copilot, and Perplexity (US data, January 2026). Each table shows mention share, the AI Visibility Index (indexed to the category leader = 100), and AI visibility momentum since the April 2025 baseline.
Finance is the highest-volume sector in this dataset. Chase leads at 15.89% mention share. The competitive cluster sits between 7–10%, brands in that range are genuinely in the AI conversation.
Note: The AI Visibility Index is indexed to each category leader (= 100). All other brands are scored relative to that ceiling.
| Brand | Mention share | AI Visibility Index | Momentum (vs. Apr 2025) |
| Chase | 15.89% | 100.0 | +37.5 ↑ |
| Fidelity | 10.24% | 64.5 | +27.7 ↑ |
| American Express | 10.16% | 64.0 | +26.1 ↑ |
| Stripe | 9.63% | 60.6 | −16.3 ↓ |
| PayPal | 9.26% | 58.3 | −20.0 ↓ |
| Capital One | 8.27% | 52.1 | +13.4 ↑ |
| NerdWallet | 7.65% | 48.2 | +34.4 ↑ |
| Vanguard | 7.37% | 46.4 | −0.7 → |
| Bank of America | 6.38% | 40.2 | +2.9 → |
Source: Similarweb AI Visibility Data, January 2026.
What ‘good’ looks like in Finance: Above 10% is category-leader territory. The 7–10% range is strong competitive positioning. Below 5% and you’re largely absent from AI-generated financial recommendations.
The overachiever signal: NerdWallet holds AI rank #7 despite a branded search rank of #73, a +66 position gap. Neither brand wins on size. Both win on structured comparison content that AI systems retrieve for specific financial questions.
The early warning: PayPal and Stripe both carry declining momentum despite strong brand recognition. A high current score combined with falling momentum is the signal most teams catch too late.
Travel shows a tight top tier, five brands cluster between 10–16%, just below Expedia’s lead at 18.18%.
| Brand | Mention share | AI Visibility Index | Momentum (vs. Apr 2025) |
| Expedia | 18.18% | 100.0 | +17.0 ↑ |
| Delta | 16.06% | 88.3 | +36.3 ↑ |
| Southwest | 10.62% | 58.4 | +39.9 ↑ |
| Skyscanner | 10.48% | 57.7 | +3.1 → |
| Airbnb | 10.14% | 55.8 | −17.2 ↓ |
| American Airlines | 10.03% | 55.2 | −0.1 → |
| TripAdvisor | 9.90% | 54.5 | −31.6 ↓ |
| Marriott | 9.61% | 52.8 | +7.1 ↑ |
| Hilton | 8.15% | 44.8 | +13.7 ↑ |
Source: Similarweb AI Visibility Data, January 2026
What ‘good’ looks like in Travel: 10–18% is the top-brand range. Below 8% and you’ve dropped off the main competitive cluster.
The TripAdvisor warning: TripAdvisor holds a 54.5 index score but its momentum has collapsed 31.6 points from April 2025, a brand in structural AI decline despite a strong current rank. Southwest carries +39.9 momentum and is accelerating toward the brands ranked above it.
Consumer Electronics has the most extreme leader gap. Apple holds 54.38%, cited in more than half of all AI responses in this category. The 41-point gap between Apple and Samsung (#2) is the largest in the dataset.
| Brand | Mention share | AI Visibility Index | Momentum (vs. Apr 2025) |
| Apple | 54.38% | 100.0 | +0.5 → |
| Samsung | 13.17% | 24.2 | −4.4 → |
| Best Buy | 12.37% | 22.7 | +139.7 ↑ |
| Sony | 7.96% | 14.6 | −8.9 ↓ |
| HP | 5.88% | 10.8 | 0.0 → |
| LG | 3.89% | 7.1 | −26.9 ↓ |
| B&H Photo | 3.89% | 7.1 | +196.9 ↑ |
| Ring | 3.22% | 5.9 | +15.8 ↑ |
| Logitech | 3.04% | 5.6 | +12.6 ↑ |
Source: Similarweb AI Visibility Data, January 2026
What ‘good’ looks like in Consumer Electronics: With Apple at 54%, all other scores look small by comparison. Realistically, 7–13% is the strong competitive range for any non-Apple brand. Below 4% and you’re barely registering.
The B&H Photo story: B&H has an identical current mention share to LG, 3.89%, but a momentum index of 296.9, nearly tripling its April 2025 baseline. LG’s momentum sits at 73.1 and falling. Same score, completely opposite trajectories.
Beauty has a smaller prompt volume but a dramatic visibility spread. The top five brands all land above 16%, then there’s a sharp drop below 8%, no middle ground.
| Brand | Mention share | AI Visibility Index | Momentum (vs. Apr 2025) |
| CeraVe | 27.17% | 100.0 | +0.7 → |
| Ulta | 23.51% | 86.5 | +219.0 ↑ |
| Sephora | 20.06% | 73.8 | +32.8 ↑ |
| La Roche-Posay | 19.64% | 72.3 | −7.4 ↓ |
| The Ordinary | 16.09% | 59.2 | −11.4 ↓ |
| e.l.f. Cosmetics | 7.42% | 27.3 | −14.0 ↓ |
| Dove | 5.96% | 21.9 | +32.4 ↑ |
| NYX | 5.02% | 18.5 | −7.0 ↓ |
| Maybelline | 4.91% | 18.1 | +10.0 ↑ |
Source: Similarweb AI Visibility Data, January 2026
What ‘good’ looks like in Beauty: Above 15% is strong top-tier presence. Being in the lower 5–8% tier means you’re competing in a different league than the top five entirely.
The Ulta compounding effect: Ulta’s monthly momentum progression from September 2025 to January 2026: 216.8 → 266.5 → 272.0 → 291.9 → 319.0. That’s sustained compounding across five months, not a spike. CeraVe leads on mention share but is essentially flat at +0.7 momentum.
Fashion tells the most counterintuitive story. Nike leads at 16.02%, but its momentum index has declined to 86.5. The brands accelerating are New Balance (+76.1), Uniqlo (+76.4), Gap (+65.8), and H&M (+58.1).
| Brand | Mention share | AI Visibility Index | Momentum (vs. Apr 2025) |
| Nike | 16.02% | 100.0 | −13.5 ↓ |
| Gap | 8.29% | 51.8 | +65.8 ↑ |
| Coach | 8.25% | 51.5 | −28.5 ↓ |
| Adidas | 8.20% | 51.2 | +6.2 → |
| New Balance | 7.51% | 46.9 | +76.1 ↑ |
| Nordstrom | 7.43% | 46.4 | −22.4 ↓ |
| Uniqlo | 5.27% | 32.9 | +76.4 ↑ |
| H&M | 4.75% | 29.6 | +58.1 ↑ |
| American Eagle | 4.71% | 29.4 | −23.4 ↓ |
Source: Similarweb AI Visibility Data, January 2026
What ‘good’ looks like in Fashion: 8–16% is the current top-brand range. Below 5% is the lower tier. In Fashion more than any other sector, momentum is the number that matters most, the rankings are in active flux.
Nike vs. New Balance: Nike sits at 16% with −13.5 momentum. New Balance sits at 7.5% with +76.1 momentum. On a straight trajectory, New Balance overtakes multiple brands ranked above it within the year. Current score is the lagging indicator. Momentum is the leading one.
News is the clearest proof that AI visibility has nothing to do with brand size. Reuters leads at 22.98% despite having only 1.5M monthly branded searches. Fox News, with 42.1M branded searches, the highest in the category, ranks #7 at just 7.04%.
| Brand | Mention share | AI Visibility Index | Momentum (vs. Apr 2025) |
| Reuters | 22.98% | 100.0 | −5.3 → |
| The Independent | 20.29% | 88.3 | +105.6 ↑ |
| The Guardian | 13.87% | 60.4 | −29.7 ↓ |
| AP News | 13.04% | 56.8 | −33.9 ↓ |
| CBS News | 8.07% | 35.1 | +68.1 ↑ |
| Washington Post | 7.25% | 31.5 | +171.5 ↑ |
| Fox News | 7.04% | 30.6 | +25.7 ↑ |
| WSJ | 6.00% | 26.1 | −47.7 ↓ |
| NYT | 5.80% | 25.2 | +55.5 ↑ |
Source: Similarweb AI Visibility Data, January 2026
What ‘good’ looks like in News: 20%+ is true AI authority territory. 7–14% is the competitive mid-tier. Below 5% and you’re effectively absent from AI-generated news recommendations.
The WSJ collapse: WSJ’s momentum index has dropped to 52.3, nearly halving from its April 2025 baseline, the sharpest single-brand decline in the entire dataset. The most likely cause is paywall restrictions limiting AI crawler access. Washington Post carries a momentum index of 271.5, nearly tripling, driven by substantially more accessible content.
Find your industry, identify what the category leader holds, and use the strong competitive range as your realistic target.
| Sector | Prompts analyzed | Leader | Leader share | Strong competitive range | Floor |
| Consumer Electronics | 7,334 | Apple | 54.38% | 7–13% | ~4% |
| Beauty | 957 | CeraVe | 27.17% | 15–23% | ~5% |
| News and Media | 483 | Reuters | 22.98% | 7–20% | ~5% |
| Travel | 3,768 | Expedia | 18.18% | 10–16% | ~8% |
| Fashion | 2,316 | Nike | 16.02% | 7–14% | ~5% |
| Finance | 11,073 | Chase | 15.89% | 7–10% | ~5% |
Source: Similarweb AI Visibility Data, January 2026.
The most important pattern across all six sectors: AI visibility does not mirror search dominance or brand size. Fox News has more branded searches than Reuters but a fraction of its AI visibility. NerdWallet has a fraction of Chase’s brand awareness but competes directly with it in AI-generated financial recommendations. The brands winning are winning on content architecture, not on budget, domain authority, or brand recognition.
I use Similarweb’s AI Brand Visibility tool to track these numbers in real time. Let me walk you through the features I rely on most.
The LLMs Comparison view scores brands by visibility across individual models, showing how frequently each brand appears in LLM responses for the topics you’re tracking. Here’s the practical workflow I used, running it for 7-Eleven:
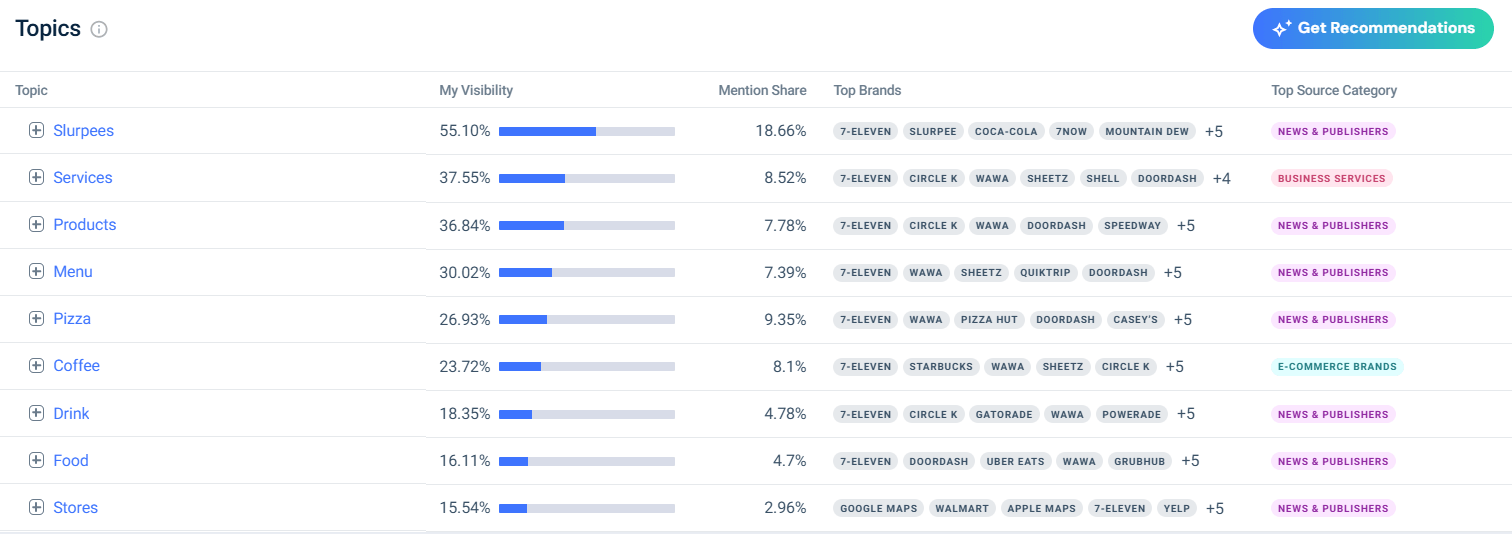
I opened a new campaign for 7-Eleven and selected the topics I wanted to analyze. The Topics view immediately showed where 7-Eleven holds its strongest AI presence. Looking at the screenshot below, 7-Eleven’s highest visibility is in Slurpees. Topics like Food and Stores are lower, meaning AI systems are far less likely to mention 7-Eleven when users ask about food or store locators than when they ask about Slurpees or branded drinks. That alone tells you where to prioritize content investment.
I checked my competitors’ LLMs Comparison for the topics I’m tracking and found out that 7-Eleven’s average visibility score of 29% puts it clearly ahead of its competitors. That 15-point gap between 7-Eleven and Wawa is meaningful, it signals that AI systems consistently surface 7-Eleven as the primary brand in convenience store queries. But the aggregate number hides something important, which is where Step 3 comes in.
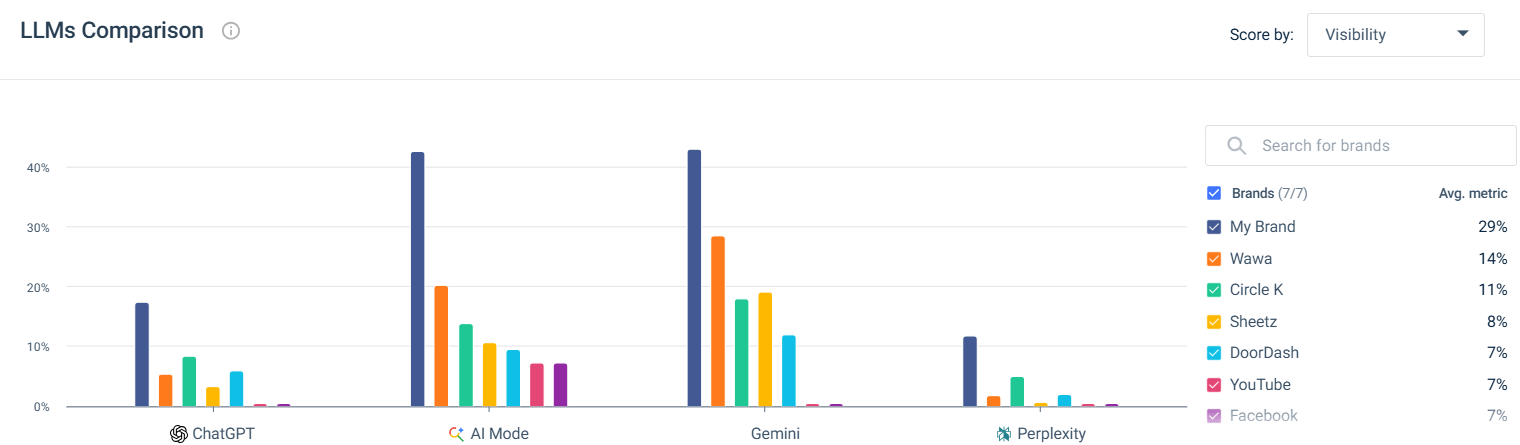
A brand that looks strong in aggregate can be nearly invisible in one model and dominant in another. That gap reveals exactly where to focus, because ChatGPT, Perplexity, Google AI Mode, and Gemini each use different retrieval logic and different source preferences.
Looking at the LLMs Comparison chart for 7-Eleven, the cross-model variation is striking. In ChatGPT, 7-Eleven’s visibility sits around 18%, modest, and only a few points ahead of Wawa. In AI Mode and Gemini, it jumps to around 42–43%, with Wawa also rising to ~20–29% respectively. In Perplexity, 7-Eleven drops back down to roughly 11%, and the entire competitive field compresses near zero.
What this tells me practically: 7-Eleven’s AI visibility story is not uniform. It dominates AI Mode and Gemini, is competitive in ChatGPT, and drops significantly in Perplexity. If I were running this account, Perplexity would be my first optimization target, the gap between its performance there versus AI Mode is the largest of any platform, and closing that gap represents the biggest incremental visibility opportunity.
What makes this actionable is the Topics view: “News & Publishers” shows up as the top source category across almost every topic 7-Eleven tracks. That tells you exactly where to focus, earned media and press coverage are the primary lever for improving visibility in this category, not owned content alone.
There’s no single number that defines a good AI brand visibility score. After looking at Similarweb’s data across six industries, the answer is: it depends on your sector, your competitive cluster, and which direction you’re moving.
Category leaders range from 15.89% in Finance to 54.38% in Consumer Electronics. The floor of meaningful visibility, where you’re genuinely in the AI conversation, sits around 5–8% in most sectors. Where you land relative to your direct competitors matters far more than any absolute number.
The brands winning in AI search aren’t the biggest or the most famous. They’re the ones that built content AI trusts. That’s a race anyone can enter, but only if you’re measuring the right things.
What is a good AI brand visibility score?
A good AI brand visibility score depends entirely on your industry and competitive set. According to Similarweb’s AI Visibility Data (January 2026), category leaders range from 15.89% in Finance (Chase) to 54.38% in Consumer Electronics (Apple). A strong competitive score in most sectors falls in the 7–20% range. Anything below 5% in your core category signals effective absence from AI-generated recommendations. Always benchmark against direct competitors rather than a universal number.
How is an AI brand visibility score calculated?
The core calculation divides the number of tracked prompts where your brand appears in an AI-generated response by the total number of tracked prompts, then multiplies by 100. Most platforms refine this with position weighting (first-mention appearances count more), prompt volume weighting (high-intent prompts carry more weight), and cross-LLM consistency signals. Similarweb’s tool additionally tracks citation rate, whether your URL is cited as a source, as a separate signal from brand mention rate.
Does my AI visibility score vary across different LLMs?
Yes, significantly. The same brand can show 20–30 percentage point differences across ChatGPT, Google AI Mode, and Perplexity for the same category. Each model uses different training data, retrieval logic, and update frequencies. Always track each LLM separately. The gap between platforms reveals exactly where to focus optimization efforts.
Why is my AI visibility score different from my search ranking?
Traditional SEO ranks pages based on relevance and authority signals in a search index. AI visibility measures how often your brand appears in synthesized AI-generated responses, based on training data patterns and retrieval from trusted sources.
How often should I track my AI brand visibility score?
Weekly tracking is the recommended cadence for fast-moving categories. AI models update their retrieval sources on varying schedules, and significant shifts, new competitor content, earned media coverage, model updates, can move visibility scores within weeks. Monthly reporting is the minimum for trend analysis, but weekly data gives you the early signal needed to catch declines before they become structural.
Can a smaller brand achieve a high AI visibility score against larger competitors?
Yes, and the data proves it. NerdWallet ranks seventh in Finance AI visibility despite ranking 73rd by branded search volume. B&H Photo nearly tripled its Electronics AI visibility momentum between April 2025 and January 2026. WhoWhatWear holds a +69 position overperformance in Fashion. What these brands share is content depth, structured formats, and a focus on answering the specific questions AI systems retrieve.
How do I start tracking my AI brand visibility score?
Similarweb’s AI Brand Visibility tool lets you set up topic tracking and see your brand’s visibility across ChatGPT, Google AI Mode, and Perplexity within 24 hours of campaign setup. Start by selecting the 3–5 topics most directly tied to your business, establish your baseline score against direct competitors using the LLMs Comparison view, then track weekly. The benchmark tables in this article give you the sector-level context to interpret what your numbers actually mean.
Senior SEO Specialist at Similarweb
Maayan is a senior SEO specialist with 7+ years of experience in SEO. She loves complex research projects, creating SEO strategies and performing technical audits.
Dark Funnel Metrics: What to Measure When Buyers Decide Before They Click

What Happens After AI Recommends Your Brand?
ChatGPT Ads CTR by Country: Brazil, Mexico and Japan Out-Click the US by More Than 2x
Give it a try or talk to our insights team — don’t worry, it’s free!