



What Happens After AI Recommends Your Brand?
by Darrell Mordecai7 Min.
Oct 14, 2026

Picture a marketing director asking ChatGPT which competitive intelligence tools to shortlist for her team. Your brand is mentioned in the answer, but there’s no link, so there’s no click, no session, and no evidence recorded for that search.
Four days later she searches your name on Google, lands on your pricing page, and leaves. Your analytics counts one organic visit from a branded query.
The last step is logged correctly. The cause is not logged at all.
That gap is why dark funnel metrics now have to do the job traffic used to.
Gartner’s survey of 632 B2B buyers found that 61% prefer a rep-free buying experience. G2, a software review marketplace, surveyed 1,076 software buyers in March 2026 and found that 51% now start their research in an AI chatbot more often than in Google, and that 69% chose a different vendor than planned because a chatbot recommended it. The decision forms in places that never send you a session.
Traffic records the visit after the decision, making it a late witness (one that insists it saw everything).
Here is my thesis: in a dark funnel you cannot measure the activity. You can measure its footprint: how often AI answers name you, which of your pages they cite, how branded demand moves afterward, and what buyers say when you ask them.
Each one is a proxy, and proxies lie. So each one needs its own denominator, a validation step before you let it move budgets, and a firm rule: never add them together.
This is the measurement follow-up to my article on marketing funnel fragmentation, which explained why the journey splits across systems that cannot be matched. Here you’ll get a working definition, the five metrics that replace traffic as the verdict, the LEAD framework to decide which proxies to trust, and a guide to which metric to lead with for your business model.
A dark funnel metric measures buyer influence without click evidence. It tracks either upstream presence, such as how often AI answers name your brand, or downstream effects, such as how branded demand moves and what buyers say brought them. It is a proxy for influence, not a count of visits.
A direct metric counts an event you observed for a specific person: a session, a form fill, a purchase. A proxy metric measures a related signal in aggregate and infers influence from it: branded search volume, share of AI mentions, the percentage of buyers who name a podcast. Every dark funnel metric is a proxy.
That is not a flaw to apologize for. It is the price of measuring something nobody recorded. It does mean every proxy needs two things a session never did: a defensible denominator, and a test that it tracks something real. Both are covered below.
Dark social, a term Alexis Madrigal coined in The Atlantic in 2012, is the private sharing of links through messages, email forwards, and chat apps, which strips the referrer and files the visit under direct. The dark funnel is the wider set: dark social plus podcasts, private communities, event conversations, and AI answers. Funnel fragmentation is a different problem: every step is recorded, but never as one person.
Roi Kaufman’s guide to the B2B dark funnel covers the channels and the demand generation playbook. The metrics work for both problems because neither requires matching one user across systems. They operate at the group level, where connections do exist.
Only the footprint, not the activity. You can measure that footprint at four layers, and your confidence drops as you move down the table.
| Layer | What you can measure | Example metric | Confidence |
|---|---|---|---|
| Clicks | Visits with a source attribute | AI referral visits, branded clicks in Search Console | High that it happened, low as a measure of influence |
| Aggregate footprint | How often you appear and how demand moves after you appear | Share of AI mentions, branded search lift | Directional, until it passes the LEAD check |
| Buyer-reported influence | What buyers say shaped the decision, in their own words | Self-reported attribution | Moderate, limited by recall |
| Private conversations | Nothing. Slack threads, direct messages, and calls leave no record | None | None |
Footprints can be measured in aggregate.
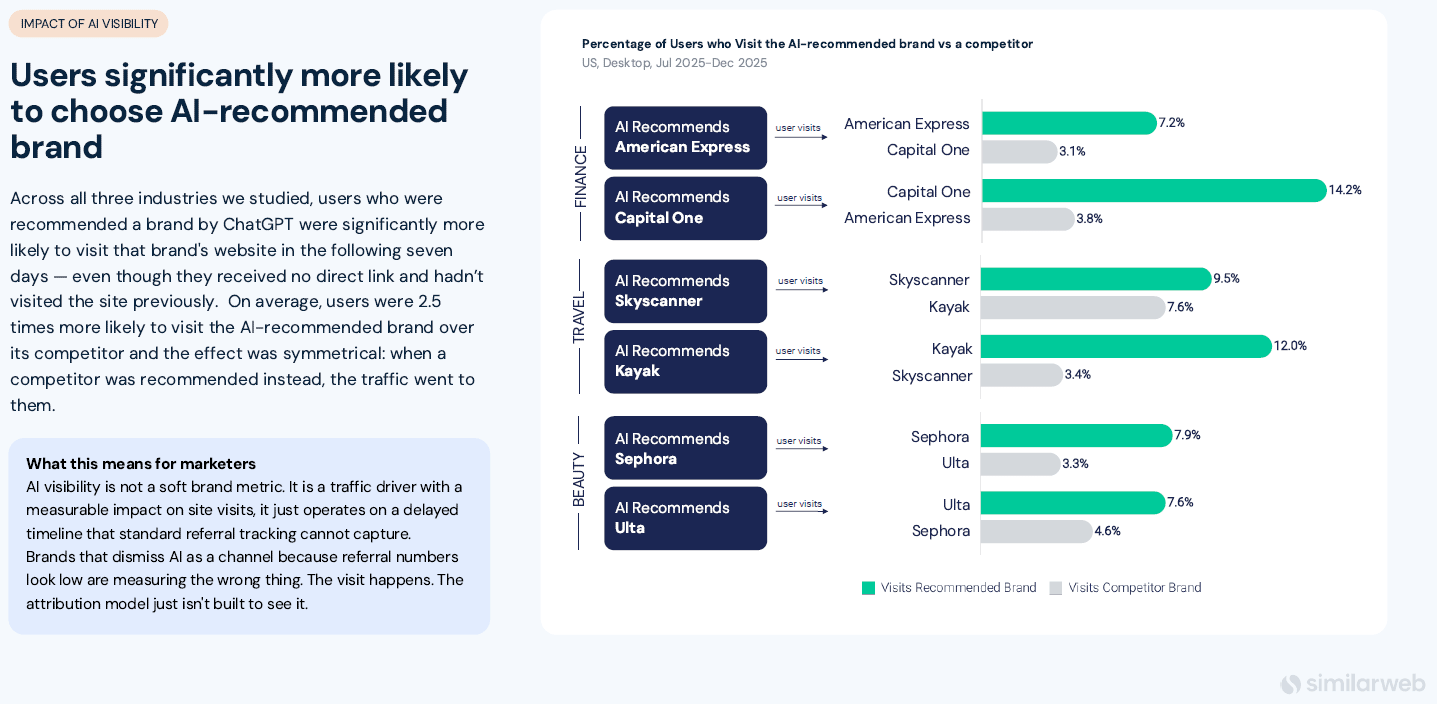
Similarweb’s Downstream Impact of AI Visibility study followed a panel’s clickstream across sites for seven days after a ChatGPT brand recommendation (US desktop users, July to December 2025) and found those users were 2.5 times more likely to visit the recommended brand than a direct competitor. It sized the effect without analyzing a single conversation.
How much of the journey is dark, as a percentage? Nobody knows. Published estimates use different definitions of “invisible,” so I do not quote one. A number you cannot reproduce is a worse planning input than an honest range built from your own self-reported attribution and branded search data.
Retire sessions from AI referrers, organic sessions per page, direct traffic growth, and last-touch source as verdicts on performance. Replace them with share of AI mentions, citations by URL, branded search lift, self-reported attribution, and unexplained direct share.
Keep traffic as a diagnostic: it tells you where people land, not whether your marketing worked.
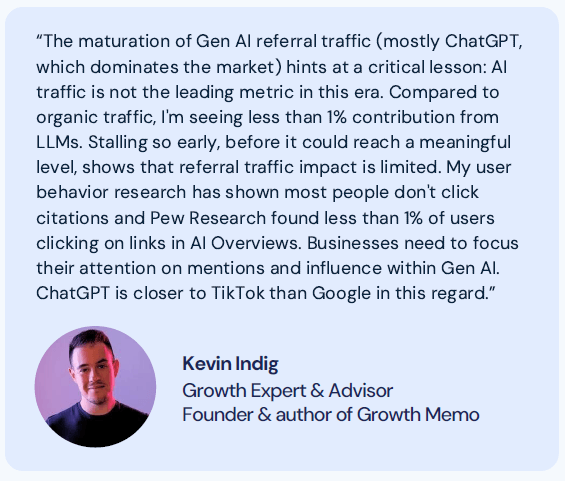
Kevin Indig, founder of Growth Memo, made the same point in Similarweb’s 2025 Generative AI Landscape: “AI traffic is not the leading metric in this era.”
“Retire” means retire as a judge, not delete from the dashboard. Three data points explain why, and the first two are covered in detail in the fragmentation article.
None of this is new in spirit. In 2022, Rand Fishkin estimated that 95% of hard-to-measure marketing shows up in three places in your analytics: direct visits, branded search, and lifts in click-through and conversion rates. His fix was a correlation dashboard, and in 2026 he is still telling marketers to replace traffic as a KPI with one.
He was right. What changed is that a fourth footprint now sits upstream of all three, and unlike a podcast or a Slack thread, it can be tracked: the AI answer itself.
Here is the retire-and-replace map.
| Retire as a verdict | Why it breaks | Replace with | Formula | Denominator |
|---|---|---|---|---|
| Traffic from AI engines | Captures about 9% of AI-influenced visits | Share of AI mentions | Responses mentioning your brand ÷ total tracked responses × 100 | All tracked responses in your category |
| Organic sessions per page | A cited page can earn citations and almost no visits | Citations by URL | Citations to the URL ÷ total citations across your prompt set | Total citations in the tracked prompt set |
| Direct traffic growth | Mixes dark social, typed URLs, bookmarks, and AI-influenced return visits | Branded search lift | Branded clicks in the 7 days after an event ÷ branded clicks in the 7 days before, minus 1 | Your own branded baseline |
| Last-touch conversion source | Records the final step only, not what led the buyer there. | Self-reported attribution | New opportunities naming a source unprompted ÷ new opportunities with a completed answer | New opportunities with an answer |
| Direct as an unexamined bucket | Hides everything your tracking cannot explain | Unexplained direct share | Opportunities arriving as direct or branded with no recorded prior touch ÷ total new opportunities | Total new opportunities |
Every replacement carries its own denominator. Share of mentions and branded search lift measure different populations, so report them side by side and read the pattern between them.
This is the same rule behind the METER framework in the fragmentation article, applied to what you stop reporting.
One more rule: the replacements are candidates, not proven causes. Each has to pass the LEAD check for your brand before it earns a place in your report.
Each metric needs four things: a numerator, a denominator, a time window, and a named source. Without all four, you can’t compare month to month or trust a trend line built on it. Three of the five metrics come from Similarweb. The other two come from your own CRM, because no panel can see what a buyer typed into your form.
In Similarweb, the AI Brand Visibility tool in the AI Search Intelligence suite tracks mentions and citations by prompt set, topic, and engine, and the keyword research tool (inside the SEO suite) supplies branded search data. Self-reported attribution and unexplained direct share live in your CRM and analytics.
Share of AI mentions is the percentage of AI responses in your category that name your brand. Divide the responses that mention you by all tracked responses, then split by engine, because each engine behaves differently.
The number only means something against a stable prompt set and a category denominator. The AI share of voice guide covers the full method, and it provides industry benchmarks for what a good AI brand visibility score looks like.
Similarweb reports two versions of this metric:
In the same period, they can move by different amounts, because the totals underneath them change differently. Pick one, write down which, and freeze the prompt set. To read direction instead of level, AI Visibility Momentum indexes the mention rate against a baseline.
The denominator also tells you how this metric relates to branded demand. In Similarweb’s 2026 AI Brand Visibility Index (113 brands across 6 industries, US, January 2026), specialist and education-led brands in every sector ranked significantly higher in AI visibility than their branded search demand would suggest.
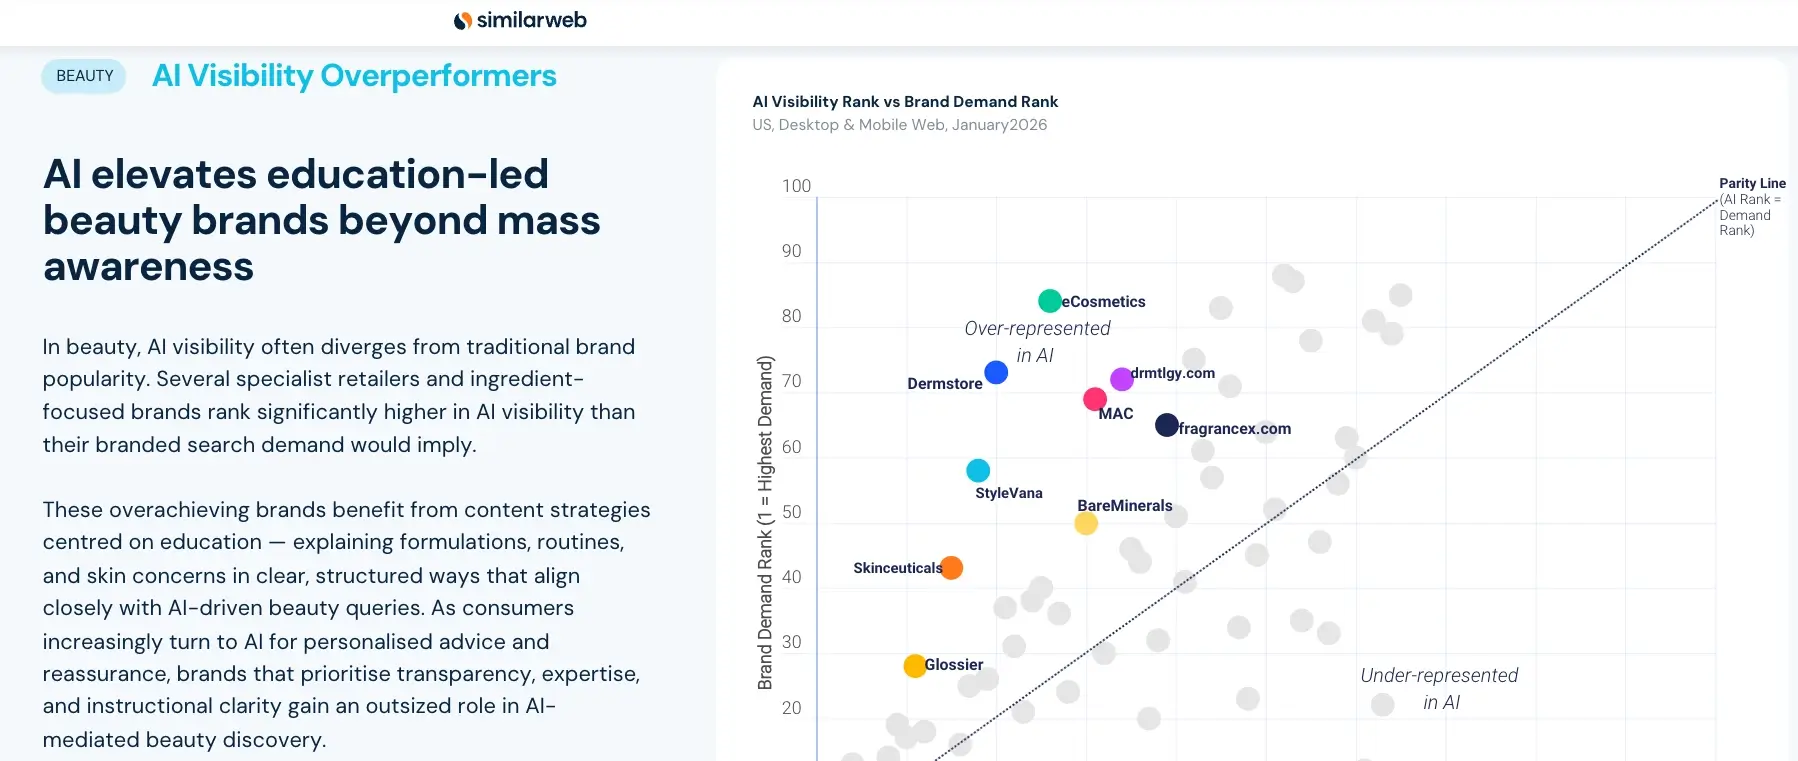
AI visibility and branded search demand measure different things, so one can rise while the other stays flat. That is why this article never measures them against the same denominator.
The Citations by URL metric counts how often each of your pages is used as an AI citation, mapped to folder depth. Split it from traffic, because the page that earns the citation is usually not the page that receives the visit.
Similarweb’s 2026 GenAI Landscape report compared ChatGPT citations with ChatGPT referral traffic (US, desktop, May 2026). Among cited URLs, 41.7% sat at folder depth two. Among referral visits, 58.8% landed on the homepage.
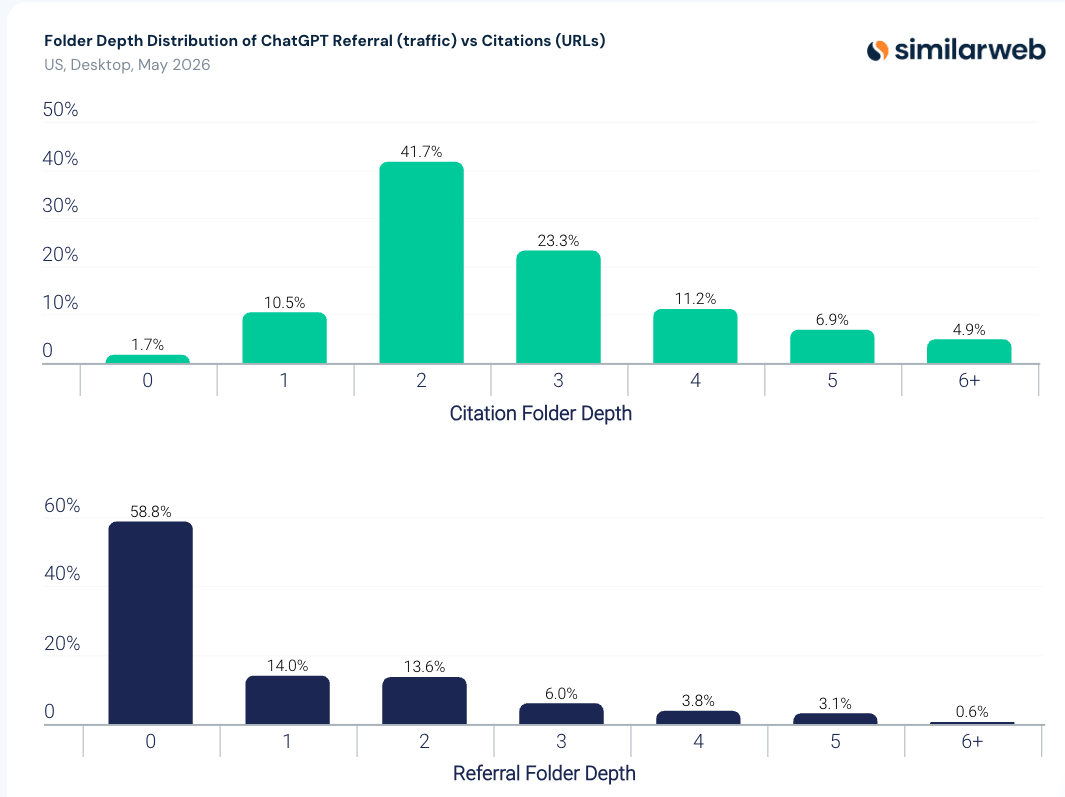
Score proof pages on citations and influence score, and arrival pages on conversion readiness. A comparison page with 40 citations and zero visits is not underperforming. It is doing its job.
You can see the same split in your own category before you build anything. Take the beauty category, for example: on Similarweb’s AI visibility leaderboard for beauty, the most-cited domain in ChatGPT answers for September 2026 (US) was the American Academy of Dermatology, followed by Allure, with Ulta and Sephora in third and fourth.
Four of the five most-cited pages were the Academy’s skin care and acne guides, and the only retailer page in the top five was a Sephora returns policy. The pages AI answers lean on are not the pages shoppers buy from.
Branded search lift is the change in branded search clicks in a fixed window after a visibility event. Compare the seven days after an AI visibility change, a press hit, or a podcast with the seven days before, then divide by your own baseline: (branded clicks after ÷ branded clicks before) minus 1. It is the closest observable echo of influence that never produced a click.
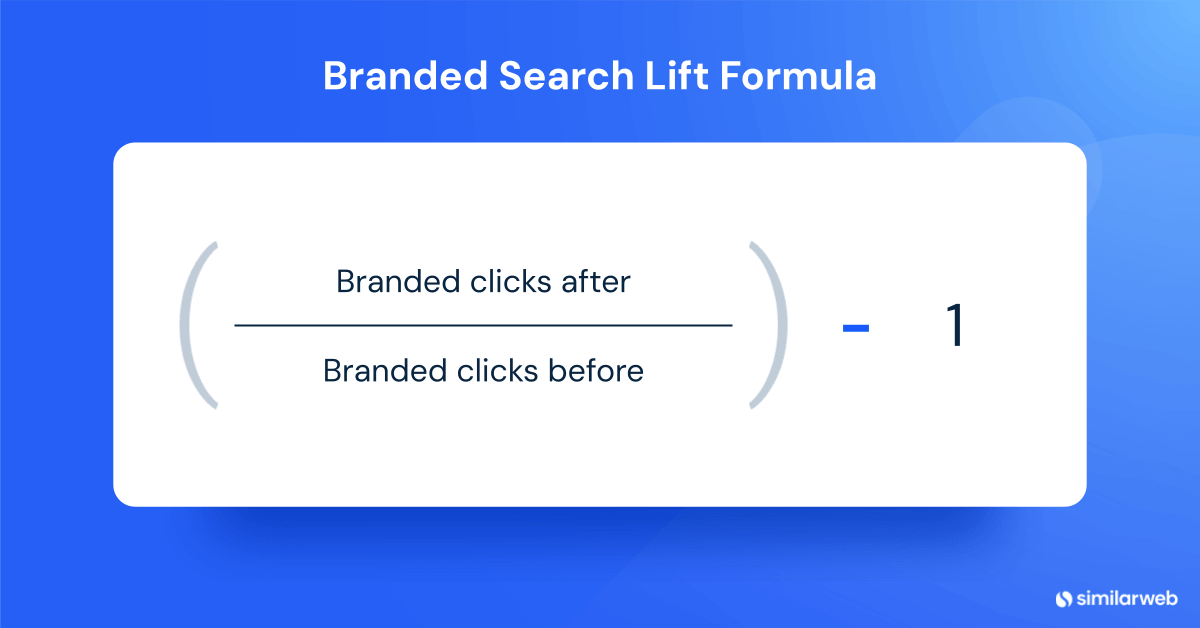
Segment your branded queries before you calculate anything.
A lift calculated on the blended head term mixes the two, and a small change in evaluative demand can vanish inside a swing in navigational demand, in either direction. Report them separately.
Next, check what else happened. A press hit, a launch, a seasonal swing, or a drop in category demand can push branded search up or down without changing how often an AI answer names you.
Google now gives you a native way to isolate branded queries. Search Console’s branded queries filter, announced on November 20, 2025, separates branded from non-branded queries without regex.
It has three main limits:
Self-reported attribution is the share of new opportunities in which the buyer names a source in their own words. Add two required free-text questions to your highest-intent form:
In my opinion, free text beats a dropdown because a dropdown only lists the channels you already know.
Each month, sort the answers into a short list of groups (AI assistant, podcast, community, peer, event, search, other), count each group, and divide by the opportunities with a completed answer. In my experience, the second question is where AI research surfaces, because buyers remember consulting an assistant even when they cannot name the tool.
Unexplained direct share is the portion of new pipeline that arrives as direct or branded, with no campaign, referral, or recorded prior touch behind it. Divide those opportunities by total new opportunities. It is a residual: what your tracking cannot explain. It should shrink as self-reported attribution fills the gap.
Copy this template and fill it monthly. It replaces the traffic verdict in your report. It does not add a total. The METER fragment for each row is in brackets. Recall appears on two rows because it has two halves: self-reported attribution and unexplained direct share
| Metric | Formula | Denominator | Window | Source | This period | Prior period | Conclusion |
|---|---|---|---|---|---|---|---|
| Share of AI mentions (Mentions) | Mentioning responses ÷ tracked responses | Tracked responses | Monthly | Similarweb AI Brand Visibility | |||
| Citations by URL (Evidence) | URL citations ÷ prompt-set citations | Prompt-set citations | Monthly | Similarweb AI Brand Visibility, Citation Analysis | |||
| Landing page and channel mix (Traffic) | Sessions by landing page type and channel ÷ total sessions. Diagnostic only. | Total sessions | Monthly | Your web analytics | |||
| Branded search lift (Elapsed) | Branded clicks after ÷ before, minus 1 | Own baseline | 7 days around each event | Search Console branded filter, Similarweb keyword research | |||
| Self-reported attribution (Recall) | Named-source opportunities ÷ answered opportunities | Answered opportunities | Monthly | CRM form field | |||
| Unexplained direct share (Recall) | Unexplained opportunities ÷ new opportunities | New opportunities | Monthly | CRM and analytics |
Use three decision rules when you read it:
I haven’t found a credible public benchmark for these five metrics, so build your own baseline over two to three cycles before you set targets.
A proxy earns trust when it moves before the outcome, repeats across events, drops when you stop the activity you think is causing it, and sits on a stable denominator. I call this the LEAD check: Lag, Echo, Absence, Denominator. A metric that fails any of the four gets reported as context, not as evidence.
In the fragmentation article, I suggested pairing AI visibility with branded search four to seven days later. Treat that as a hypothesis your data has to confirm, not a law of nature. The Similarweb study followed individual users. A weekly brand total is a blunter instrument, and blunt instruments need testing.
Proxies fail in predictable ways. A podcast appearance, a funding announcement, or a seasonal spike can lift branded search with no AI involved. A rise in mentions can reflect a changed prompt set rather than a changed market. So you test before you move budgets.
| Check | Question | How to run it | What failure means |
|---|---|---|---|
| Lag | Does the proxy move before the outcome it is supposed to predict? | Plot the weekly proxy against the weekly outcome (branded clicks or pipeline) for at least eight weeks. Test the same week and a one-week lag. | If the outcome moves first, the proxy follows, not leads. |
| Echo | Does the same relationship repeat across separate events? | Log each event and the delay before the lift. Three events with a similar shape and delay make a pattern. | One spike is an anecdote. |
| Absence | Does the proxy drop when you stop the activity you think is causing it? | Stop it in one region and keep it running in another, then compare. For example, pause a campaign or freeze content in one market. | Without a region where it keeps running, you only have correlation. This is the only check here that establishes cause. |
| Denominator | Is the metric measured against a stable base? | Freeze the prompt set, the category definition, and the window before you compare periods. | A share of mentions on a prompt set that changed last month is not comparable to the month before. |
The eight-week minimum and the three-event rule are my rules of thumb, not statistical standards.
Decide which tests you will run before you look at the results. Every extra test you try raises the odds of a false positive.
Here’s what it looks like for Ulta Beauty in the US, measuring AI presence in ChatGPT. This is an illustration of the method on one brand, not a benchmark for any other. Every series covers the same 11 complete weeks, July 12 to September 20, 2026.
In September 2026, Ulta ranked first among beauty brands on the AI leaderboard, ahead of Sephora and CeraVe. It has an editorial content program, so AI answers have something to cite, and it has promotional branded demand, so that can confuse the results. You can read three of the five metrics from outside the company.
Similarweb’s own panel study also covers this: after a ChatGPT recommendation of Ulta, 7.6% of users visited Ulta, and 4.6% visited Sephora, while after a recommendation of Sephora, 7.9% visited Sephora and 3.3% visited Ulta.
| Metric | What Similarweb shows for Ulta | What it tells you |
|---|---|---|
| Share of AI mentions (ChatGPT) | 22% of tracked responses in August, 19% in September | Presence dipped by three points. By itself. That says nothing about demand. |
| Citations by URL | In ChatGPT answers, ulta.com was the third most-cited domain in September with 1,605 citations. Its most-cited pages are editorial guides under /discover/beauty-education/, led by an everyday makeup routine for beginners (89 citations). | The pages AI answers use as proof are guides three folder levels deep. They are not the pages shoppers land on. |
| Branded search | Domain-level branded clicks: 2.10M in July, 2.12M in August, 2.08M in September. The head term “ulta” swung between 262K and 369K weekly clicks. | Flat across months, volatile across weeks. The monthly view hides what the weekly view shows. |
| Self-reported attribution, unexplained direct share | Not observable from outside the company | These need Ulta’s CRM. |
The denominator matters here. The terms “ulta” and “ulta beauty” are 69% of Ulta’s branded clicks in September, and both are navigational. Evaluative and event terms such as “ulta birthday gift,” “ulta 21 days of beauty,” and coupon queries each hold under 2%. A lift computed on the head term mostly measures people who already shop there. The leaderboard’s top beauty prompt that month, “ulta beauty vs sephora, which is better?”, is the kind of question that precedes an evaluative branded search, and the head-term count cannot see it.
Now the Lag test, run the way the steps above describe it: visibility change this week against click change next week, on 9 pairs, where a correlation of about 0.67 is needed to stand out from noise (the 5% level, two-tailed, with nine pairs).
| Test (ChatGPT visibility) | Correlation |
|---|---|
| Visibility change vs next week’s click change | +0.69 |
| Clicks leading visibility (reverse) | -0.13 |
On ChatGPT, visibility moves first and narrowly clears the threshold (+0.69 vs. about 0.67). Visibility fell in the week of August 10 (29% to 11%) and again in the weeks of September 14 and 21 (31% to 5%). Branded clicks on the head term followed, from about 350K to 263K in August and from about 345K to 269K in September.
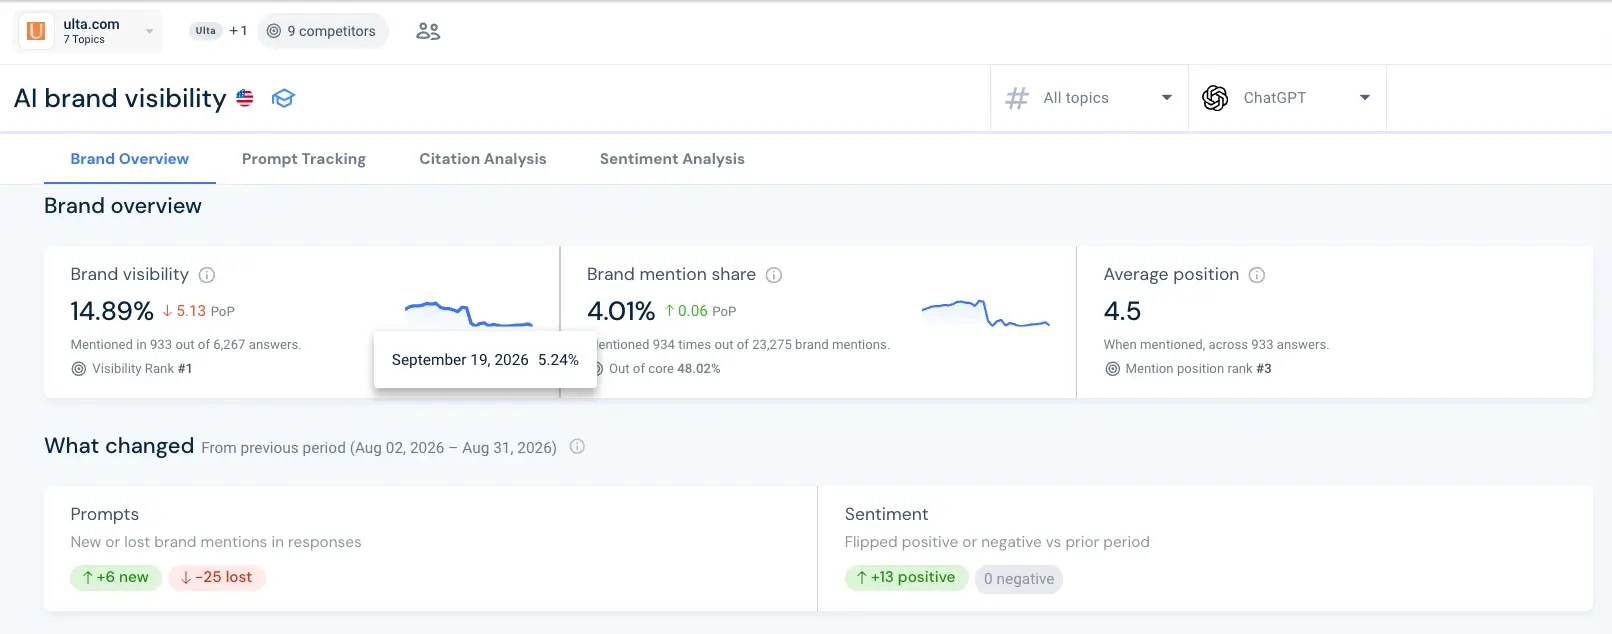
Another factor could explain the pattern: Ulta’s clicks jumped 31% the week of July 26, right when its visibility peaked, and its sale event (“ulta 21 days of beauty”) is a top branded term. A sale can lift AI mentions and branded search together, with neither causing the other.
Rule out the platform shift and the sale before crediting AI.
The result: AI visibility looks like a signal worth tracking, but the evidence is not strong enough to say it drives branded clicks. This is what dark funnel measurement usually looks like: partial evidence, not proof. Run the checks first, then ask for a budget.
A failed Lag test does not prove AI answers fail to influence buyers. It means you should not present that metric as a cause based on that evidence.
The usual suspects:
The test cannot separate those explanations, and it does not need to. It tells you what not to claim, which is more than most dashboards do.
Absence is the expensive check. Rand Fishkin’s point about incrementality is that measuring it means shutting an advertising channel off, often for months, which is why almost nobody does it. Run it only for the proxies you plan to move the real budget on.
Marketing mix modeling is the aggregate alternative when on/off tests are impractical. It estimates channel contribution from totals instead of individual tracking, which suits brand building that feeds invisible demand. It needs enough history and spend variation to work, so treat it as a quarterly validation layer, not a weekly dashboard.
Run the cheapest checks first.
Prioritize by buying cycle length and committee size. Long-cycle B2B teams should lead with self-reported attribution and branded search lift. High-volume consumer and ecommerce teams should lead with share of AI mentions and engagement quality. Agencies should standardize on the full scorecard, so every client sees the same five numbers.
| Business model | Lead metric | Supporting metric | Treat as diagnostic only |
|---|---|---|---|
| B2B SaaS, high ACV, long cycle | Self-reported attribution | Branded search lift | Sessions by channel |
| Ecommerce and consumer | Share of AI mentions | Engagement quality of AI-influenced visits | Direct traffic growth |
| Agency reporting to clients | Full scorecard, read as a pattern | Citations by URL | Single-source attribution |
One scope note before the details. The Similarweb study covers US desktop users in finance, travel, and beauty, tracked over seven days, and excludes anyone who visited the brand in the prior four weeks. It is a clean read on new acquisitions in three consumer categories, not a law for enterprise software with a nine-month cycle.
The mechanism, a visit that arrives later through search or direct, isn’t category-specific. The size of the effect is.
Start with self-reported attribution. It is free, it captures channels no tool sees, and it works at any volume. If 69% of software buyers in G2’s survey chose a different vendor because a chatbot recommended it, the only instrument that hears about that is the question you ask on your form.
Add branded search lift next, but read it as a directional pattern across several events. At low opportunity counts, a single event is noise. Self-reported attribution also has different limits from the other four: it infers nothing from aggregates, and its weakness is buyer recall.
Start with Share of AI mentions, and analyze engagement next to it. In the Similarweb study, AI-influenced visitors viewed 12.0 pages and stayed 11.8 minutes on average, against 6.5 pages and 5.6 minutes for standard visits. The pattern fits visitors who are mostly sure of their decision and are verifying it.
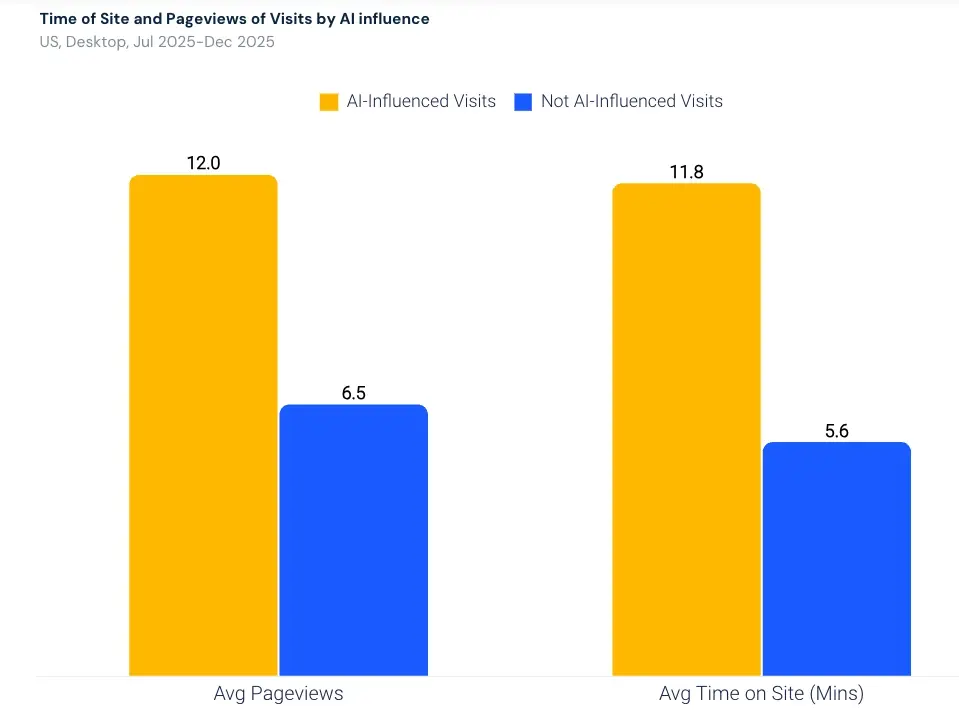
The study did not test that explanation, so treat it as a hypothesis. If it holds, judge your landing pages on whether they offer proof, pricing, and a next step, not on whether they explain what you do.
Four changes cover it, and the first two need no new tooling: a required free-text field, a branded search baseline, a frozen prompt set, and citation counts next to traffic in every audit. Run the LEAD check on whichever metric moves first, before anyone reallocates budget because of it.
Disclosure: Similarweb sells the panel and the tracking behind several figures in this article. The self-reported field and the branded search baseline cost nothing, and within a quarter they will tell you whether any of this applies to you.
Traffic did not become wrong. It became late. By the time you record a visit, the decision it records has mostly been made somewhere you were not watching, and a report built on the visit rewards whatever sits closest to the door.
The fix is not a bigger tracking stack. It is a smaller set of honest dark funnel metrics: five proxies with their own denominators, a scorecard read as a pattern, and a LEAD check that keeps proxies from passing as proof.
When mentions, branded lift, and self-reported answers move together across several events, you have a defensible read on dark funnel performance. When they diverge, you have found the fragment to work on.
If you want to track mentions and citations across engines without building it yourself, Similarweb’s AI Brand Visibility suite covers Share of AI mentions and citation-level data. Similarweb AI Studio connects those datasets with branded search and traffic, so you can ask a question in plain language and get the analysis, report, or dashboard back.
In a dark funnel, you cannot see the journey. You can still measure whether it is working.
Dark funnel metrics are proxy measures of buyer influence that happens where no click is recorded: share of AI mentions, citations by URL, branded search lift, self-reported attribution, and unexplained direct share. They infer influence from aggregate signals instead of counting visits, so each one needs its own denominator and a validation step before it informs a budget decision.
Track five: share of AI mentions, citations by URL, branded search lift, self-reported attribution, and unexplained direct share. Each has its own denominator, so read them side by side and never add them into one score. Keep traffic as a diagnostic for where people land. It stopped being a verdict because only 8.8% of AI-influenced visits in Similarweb’s study arrived as AI referrals.
Branded search is a reliable directional signal and an unreliable proof. It lifts after AI recommendations, but also after podcasts, press, launches, and seasonal swings, so it cannot say which one worked. Separate evaluative terms from navigational ones, use Search Console’s branded filter for a baseline, and confirm the relationship with the LEAD check. For large budget moves, add an on/off test.
It depends on your category and your data. Similarweb’s study tracked visits for seven days after a ChatGPT recommendation among US desktop users in finance, travel, and beauty, and 55.9% of AI-influenced visits arrived through search. Seven days is a sensible starting window, not a guarantee. Run the Lag test on your own data across several events before you build reporting around any number.
Not by itself. Direct traffic mixes typed URLs, bookmarks, dark social shares, and AI-influenced return visits. In Similarweb’s study, 19.9% of AI-influenced visits arrived as direct, against 38.8% of standard visits. Treat a direct spike as a prompt to check self-reported attribution and branded search, not as proof of any single cause.
Measure influence upstream and outcomes downstream. Upstream, track how often AI answers mention and cite you. Downstream, track branded search lift after visibility events, and ask buyers to name their sources in free text on your highest-intent form. With 68.01% of US Google searches ending without a click (SparkToro, January to April 2026), validate every proxy with the LEAD check before it informs budget.
Director of SEO & AI Search at Similarweb
Limor brings 20 years of expertise in SEO and AI Search. She thrives on solving complex problems, creating scalable strategies, and building amazing dashboards.
What Happens After AI Recommends Your Brand?

ChatGPT Ads CTR by Country: Brazil, Mexico and Japan Out-Click the US by More Than 2x

What is RAG (Retrieval-Augmented Generation)? A Marketer's Guide
Give it a try or talk to our insights team — don’t worry, it’s free!