



The Best AI Citation Analysis Tools in 2026
by Maayan Zohar Basteker8 Min.
Sep 17, 2026

Every attribution model rests on one assumption: that a buyer’s journey, linear or non-linear, leaves a trail someone can follow backward. That assumption has broken. Non-linearity never broke it, because even looping paths still left records you could track throughout. What broke it is that most of the journey now happens where no record is created at all, and the gap that creates is big enough to measure.
Similarweb’s Downstream Impact of AI Visibility study measured that gap directly. It tracked thousands of real user journeys across finance, travel, and beauty between July and December 2025, following people who received a specific brand recommendation from ChatGPT and had not visited that brand’s site in the previous four weeks. Those users were 2.5 times more likely to visit the recommended brand than a direct competitor within seven days.
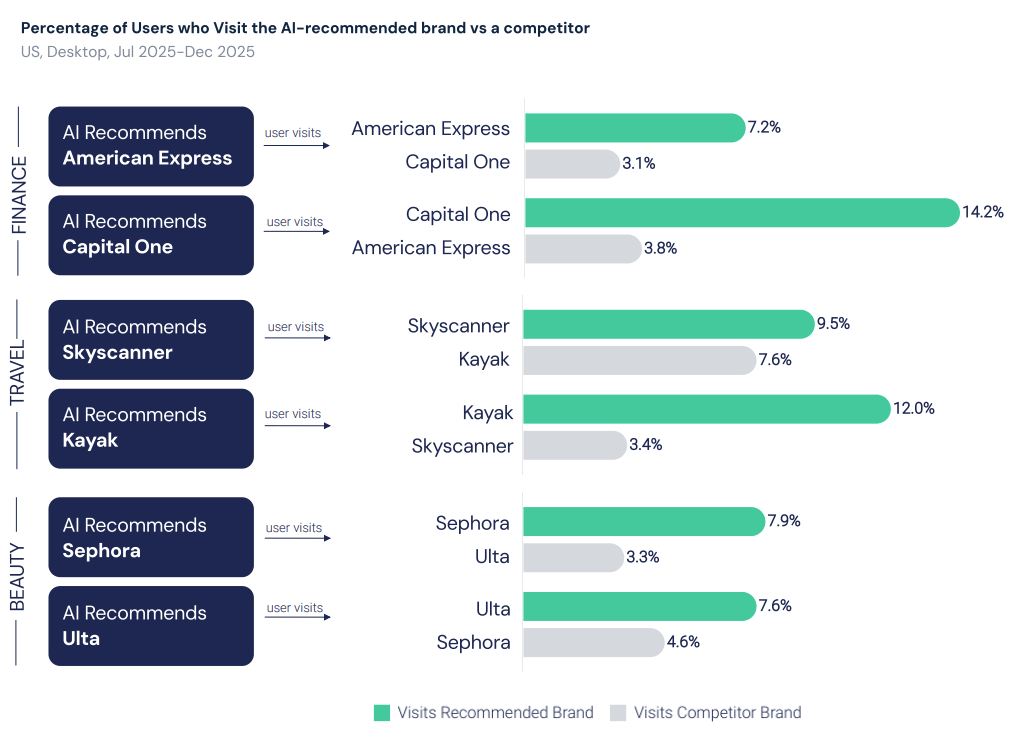
Only 8.8% of those visits arrived through a channel any analytics tool would label AI. The other nine in ten showed up as search, direct, or a non-AI referral, which means most attribution models are looking straight at AI-driven demand and filing it under something else. That is not a tracking failure you can fix by tracking harder.
Here is my thesis:
The dark funnel is an observability problem: Activity happens in channels you cannot tag (a private community, a DM, a podcast, etc.).
The fragmented funnel is the opposite: Every step gets recorded, just never in a way that shows it was one person. You cannot put a journey back together when the pieces were never connected. More tracking will not help, because the connection was never there.
This article covers what fragmentation is and how it differs from the dark funnel, why the journey itself is working while the measurement is not, what AI specifically broke, how fragmentation now runs inside your own domain, what it costs you while you are not measuring it, and the METER framework for measuring five fragments without pretending they add up to one number.
Marketing funnel fragmentation happens when one buying journey is spread across several systems, each seeing only its own part, with nothing showing those parts came from the same person. The difference from the dark funnel is the cause. The dark funnel is activity nobody recorded. Fragmentation is activity everybody recorded, in pieces that cannot be matched up.
The distinction matters because it changes what a fix looks like. If your problem is invisibility, more instrumentation helps. Add visitor identification, buy intent data, run a self-report field. That is the standard playbook, and for the classic B2B dark funnel of private Slack threads and forwarded PDFs, it is still the right playbook.
If your problem is missing connections, more tracking gives you more data, not more accuracy. You end up with several accurate systems reporting several incompatible views of the same person.
A director asks ChatGPT to compare vendors in your category. Your brand appears in the answer with no link. Four days later she Googles your brand name, lands on your homepage, browses pricing, leaves. Nine days after that, a colleague forwards her your comparison page from a Slack thread. Three weeks later she fills a demo form and selects “Google” from the dropdown.
Four fragments:
No user ID, session ID, cookie, or IP appears in more than two of those systems.
That is not a tracking gap. Nothing in those systems can prove it was one person, so you should score your measurement stack on how accurately each fragment is measured rather than how much of the journey it reconstructs.
| Dimension | Dark funnel | Fragmented funnel |
|---|---|---|
| Root cause | Activity happens in untaggable channels | Activity is tracked, but by systems that cannot tell it was one person |
| What is missing | The signal | The connection |
| Typical fix attempted | Visitor ID, intent data, self-report fields | The same tools, applied harder |
| Why the fix stalls | It does not, for genuinely dark channels | The pieces cannot be matched up, however hard you try |
| Correct unit of measurement | Account-level engagement | Per-fragment metric with its own denominator |
| Failure mode | You miss demand | You double-count it, or credit the wrong channel with confidence |
| What “good” looks like | Higher coverage of anonymous activity | Five honest numbers instead of one dishonest one |
The most fragmented journeys are the ones most likely to end in a purchase. That single fact should change how you read everything else here, because it means fragmentation is not decay in the buying process. It is what considered buying looks like now, and what failed is the model you use to record it.
Similarweb’s State of Ecommerce 2026 report compared US desktop shopper journeys by the tools they used in June 2026.
The table below follows the sequence of a journey: search stops forwarding people, the answer replaces the click, the influence lands days later through another channel, and the visit it produces is worth more than the ones you can trace.
| Source | What it measured | Finding | What it establishes |
|---|---|---|---|
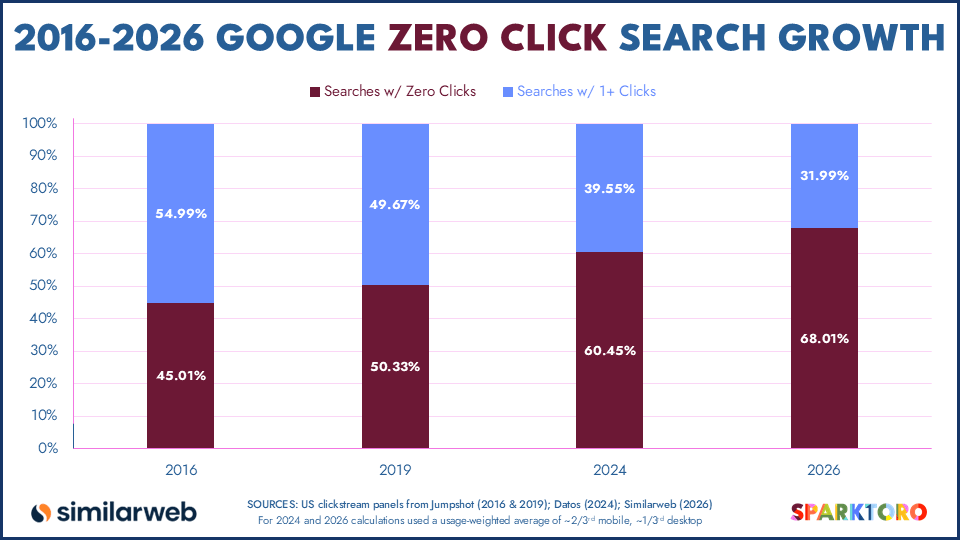
| SparkToro study, using Similarweb clickstream | US Google searches, January to April 2026 | 68.01% ended without a click, up from 60.45% in 2024 | The search surface largely stopped forwarding people |
| Pew Research Center | 68,879 Google searches from 900 US adults, March 2025 | Clicks on a link inside an AI summary occurred in 1% of visits | Presence in an answer no longer implies a visit |
| Similarweb, The Downstream Impact of AI Visibility | AI-recommended brand journeys, US desktop, July to December 2025 | 2.5x visit lift, but only 8.8% arrived via an AI channel | Influence and visit have become separately observed events |
| Adobe Analytics | More than one trillion visits to US retail sites, Q1 2026 | AI-referred traffic grew 393% year over year and converted 42% better than non-AI traffic in March 2026 | The fragment nobody can attribute is the highest-value one |
| Similarweb Market Research Panel | US consumer survey, January 2026 | After an AI tool mentions a brand, 40% search Google for it, 36% compare it on Google, 34% ask the AI a follow-up, 28% go direct, and 8% ignore it | The split is observable at the exact moment it happens |
| Similarweb, Advertising in AI | ChatGPT ad impressions and conversation intent, 2026 | 46% of users who opened with no commercial intent had buying signals by the time an ad appeared | The conversation generates intent, it does not just carry it |
| Similarweb, State of Ecommerce 2026 | US desktop shopper journeys and conversion, June 2026 | AI-and-Search journeys touched 14.9 sites and converted at 23.0%, against 10.1 sites and 17.3% for Search alone, and 7.3 sites and 12.5% for AI alone | The most fragmented journeys convert best |
| Similarweb, 2026 GenAI Landscape | AI citations against referral traffic, US desktop, May 2026 | 41.7% of cited URLs sit at folder depth two, while 58.8% of referrals land on the homepage | The page that gets cited is not the page that gets the visit |
Read one by one, each dataset covers one fragment of a journey. Read together, the Similarweb reports run the length of the path, from the search that never forwards anyone to the sale at the end.
More fragments, more conversion. Journeys with the most touchpoints, the most tools, and the least chance of being reconstructed by any attribution model are most likely to end in a sale.
Adobe Analytics, based on more than one trillion visits to US retail sites, found the same pattern in transaction data: AI-referred traffic grew 393% year over year in Q1 2026 and converted 42% better than non-AI traffic in March 2026. Twelve months earlier, the same channel converted 38% worse.
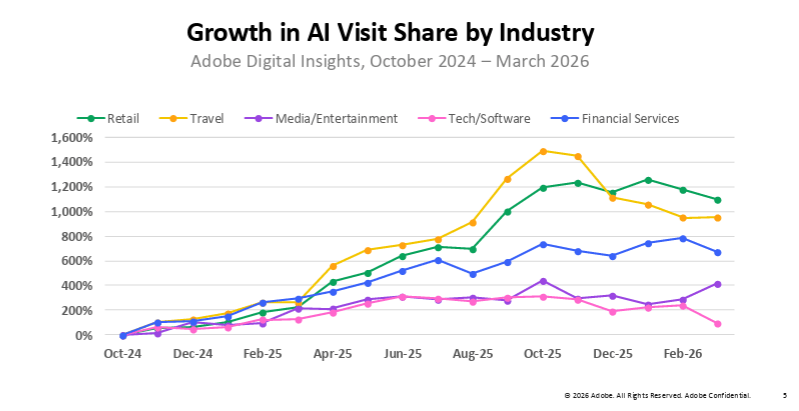
Adobe’s data comes from analytics running on its own customers’ retail sites. Similarweb’s comes from a behavioral panel and clickstream. Different instruments, no shared data, and the same conclusion: the fragment you cannot attribute is the one carrying your best buyers.
AI also did not replace anything. In 89% of shopper journeys that involve AI, Search is there too, and only 11% use AI on its own. So the change is not that journeys got longer or less linear. It is that a new fragment appeared which is simultaneously high-influence, high-value, and invisible to the systems that decide where budget goes.
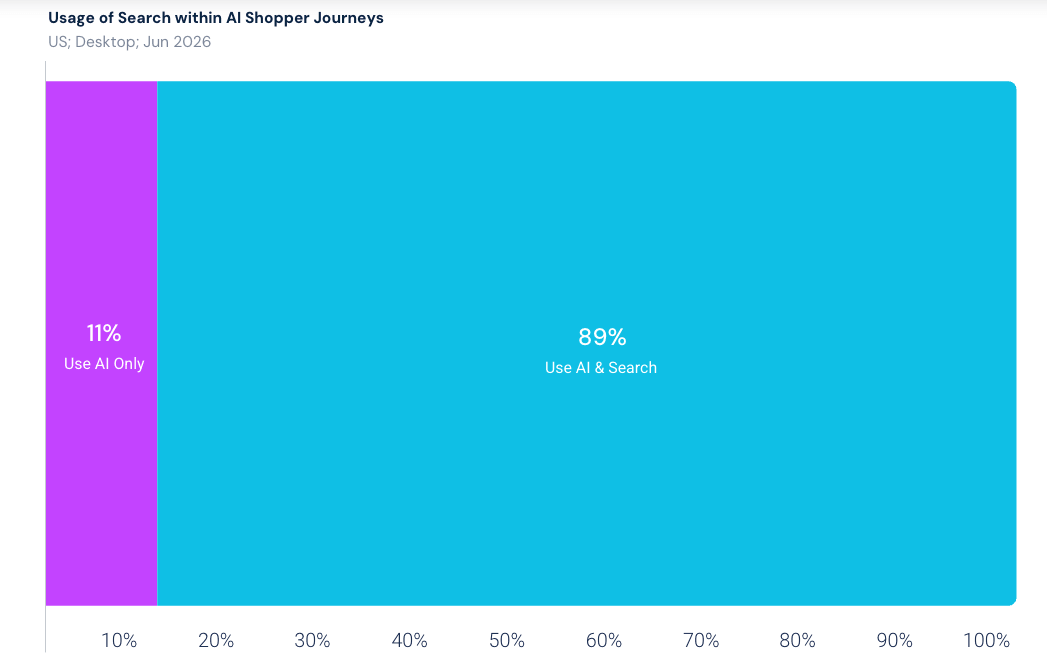
The takeaway for your reporting: stop treating fragmentation as a problem to be reversed. Benchmark your attribution coverage against what your model can actually observe, not against 100%. If it claims to explain 80% of pipeline origin while seeing under a tenth of AI-influenced demand, it is not measuring well. It is guessing confidently.
AI broke the temporal and channel link between influence and visit. In Similarweb’s Downstream Impact of AI Visibility data, the visit caused by an AI recommendation arrives days later, through search or direct, from a user carrying no referral header. The influence is real and measurable in aggregate. The connection to the individual visit is gone.
Google’s AI Mode decomposes a question into subtopics and issues multiple related searches concurrently before assembling one answer. The user asks once. The system searches many times. None of those sub-searches appear in your analytics, and the user never sees the URLs that were considered and rejected.
Usage type matters as much as volume. Chatterji and colleagues classified roughly 1.1 million anonymized ChatGPT conversations from May 2024 to June 2025 for the National Bureau of Economic Research and found that 49% of messages were “Asking,” meaning the user wanted information or advice rather than a deliverable, against 40% “Doing.”
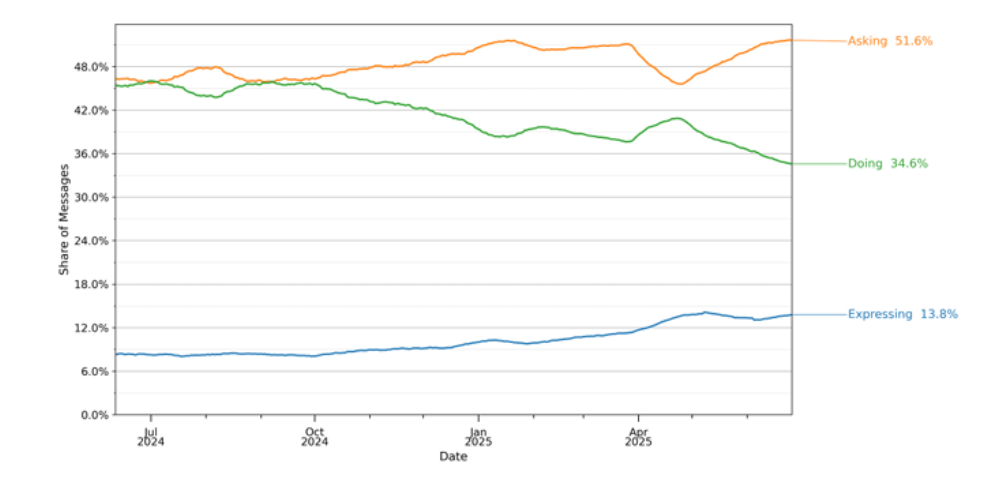
Practical guidance, seeking information, and writing accounted for close to 80% of all conversations. The dominant behavior is decision support, which is exactly what used to happen on your comparison pages.
Conversations do more than host research. They create intent. Similarweb’s Advertising in AI report found that 46% of users who opened a ChatGPT conversation with no commercial intent had developed buying signals by the time an ad appeared, and 69% of the opening intent was still there alongside it. Demand is being created inside the conversation, in a place no keyword system can see.
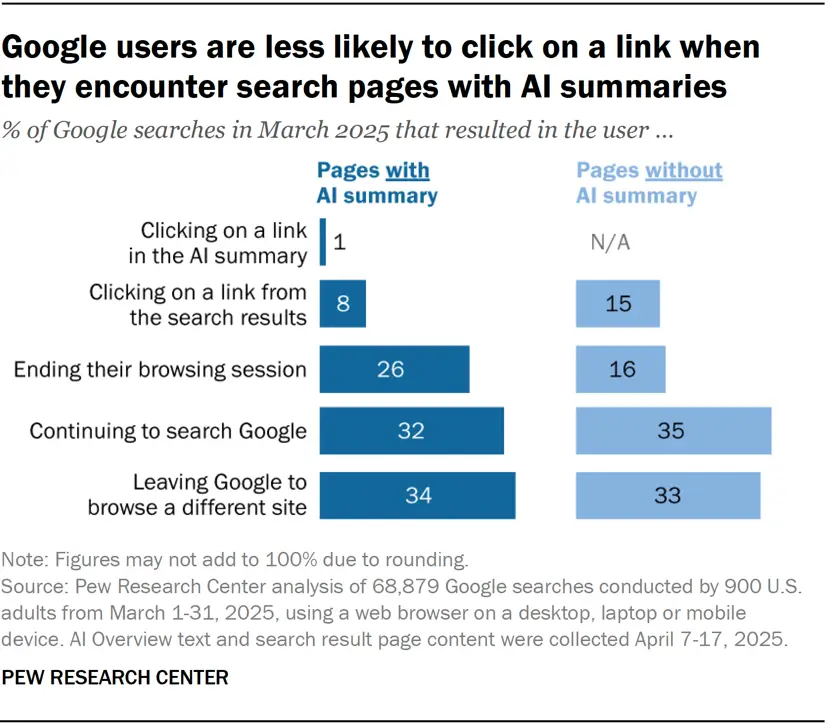
Clicks are getting rarer too. Pew Research Center analyzed 68,879 Google searches from 900 US adults in March 2025 and found that when an AI summary appeared, users clicked a traditional result in 8% of visits, against 15% without one. Clicks on a link inside the summary itself occurred in 1% of visits. Sessions ended entirely on 26% of pages with a summary, compared to 16% without.
Similarweb’s Market Research Panel surveyed US consumers in January 2026 and asked what they do after an AI tool mentions a brand. Forty percent search Google for it, 36% use Google to compare it against alternatives, 34% ask the AI a follow-up, and 28% go straight to the site. Only 8% do nothing.
Those answers show the split as it happens. One mention produces four different next actions across three different surfaces, and three of the four leave no trace connecting back to the mention. This is how AI has changed the consumer journey, measured at the point of the split rather than inferred from what arrives downstream.
In the Similarweb study of AI-influenced journeys, the channel mix of the eventual visit looked nothing like an AI traffic report. Search accounted for 55.9% of AI-influenced visits, direct for 19.9%, other referrals for 13.5%, and AI referral for 8.8%. Standard visits, by contrast, split 40.4% search and 38.8% direct.
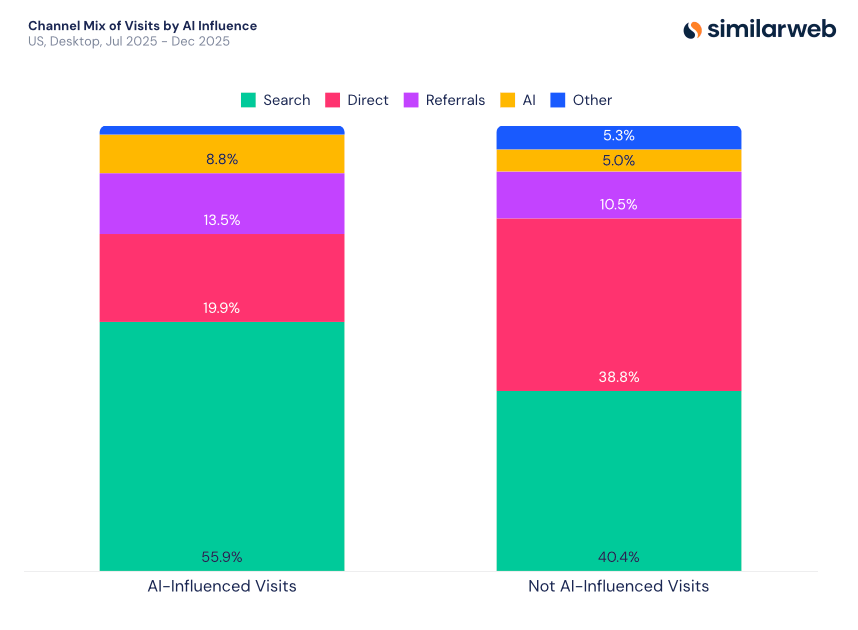
If your reporting treats AI as a channel and sizes it from referral data, it captures about a tenth of the actual effect.
The same report mapped where AI sits in US desktop shopper journeys in June 2026 and found it appears as a middle touchpoint in 76.1% of the journeys where it is used, against 23.2% as the first touchpoint and 18.4% as the last. Search shows up first in 50.0%, in the middle in 59.5%, and last in 56.2%.
First-touch models therefore miss AI in roughly 75% of the journeys it appears in, and last-touch models miss it in more than 80%. Both miss it for the same reason: it sits in the middle, and neither model measures the middle.
The engagement data makes the misattribution more expensive. AI-influenced visitors viewed 12.0 pages and stayed 11.8 minutes on average, against 6.5 pages and 5.6 minutes for standard visits. These are the visitors doing the most work on your site, and your model is filing them under branded search.
One caveat: The study covers US desktop behavior across finance, travel, and beauty, tracked over a seven-day window, and excluded anyone who had visited the brand in the prior four weeks or named the brand in their prompt. It is a clean read on new acquisition in three consumer categories, not a universal law for enterprise software with a nine-month cycle.
The mechanism, though, is not category-specific.
What to do: stop reporting AI as a referral channel. Report it as a leading indicator with a lag, and pair it with branded search volume for the same period. If AI visibility rises and branded search rises four to seven days later, you have found your connection, at the group level, which is the only level where one exists.
Fragmentation is not only between platforms. Within a single website, the page that earns the AI citation and the page that receives the resulting visit are usually different. Optimizing one does nothing for the other, and most teams measure only the second.
Similarweb’s 2026 GenAI Landscape report analyzed ChatGPT citations against ChatGPT referral traffic in the US on desktop in May 2026, and the two distributions barely overlap. Among cited URLs, 41.7% sat at folder depth two and 65.0% sat at depth two or three combined. Among referral visits, 58.8% landed on the homepage.
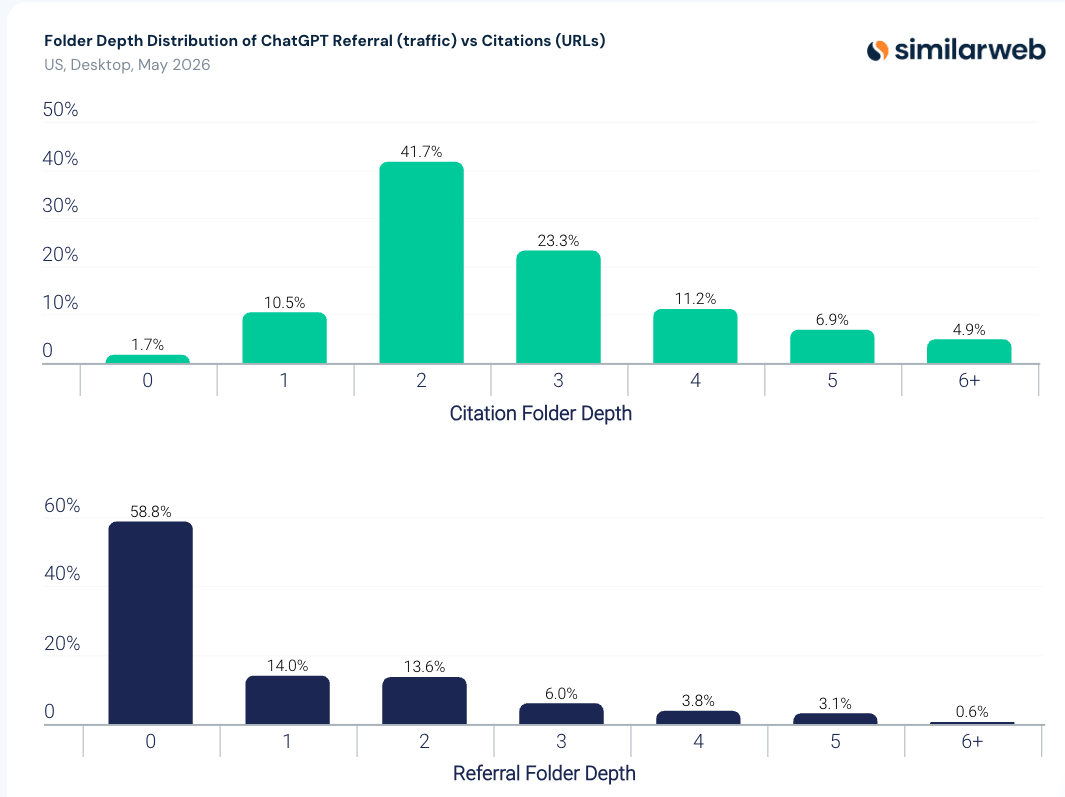
Your deep comparison page, your integration docs, your pricing methodology post: those are the evidence the model reads. Your homepage is where the human shows up. They are different jobs, and they need different KPIs.
This split widened over 2026. Following ChatGPT’s May 7 search update, the share of its referrals landing on homepages rose from roughly 25% to nearly 60% across the following weeks. Cited pages stayed deep. Landing pages got shallower.
There is a version of this problem inside your log files too, which is worth mapping separately through AI bot funnel analysis: the crawl path an AI system takes through your site is a third distribution, matching neither citations nor visits.
What to do: split your page inventory into proof pages and arrival pages, and score them on different metrics.
For example: A comparison page that earns 40 citations and zero direct visits is not underperforming. It is performing exactly its function.
Fragmentation is not an inconvenience. It is a recurring cost, paid in three forms: demand that forms without you, traffic that stops following visibility, and signals that reach you after the market has already moved. None of the three appears as a line item, so most teams pay all three at once.
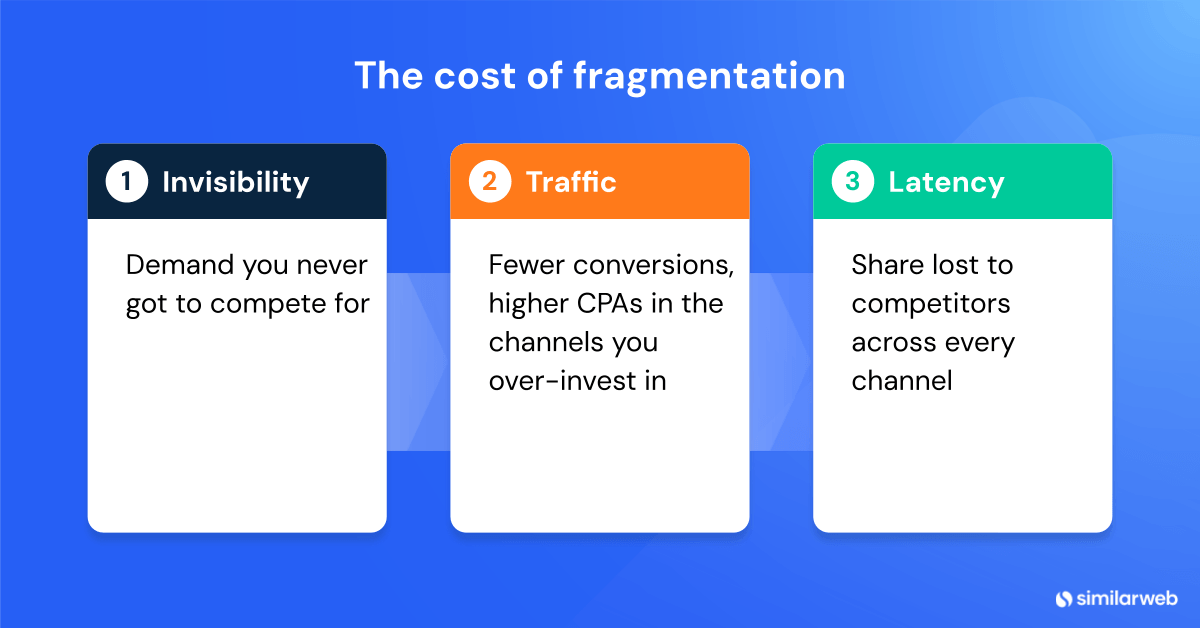
Every fragment your model cannot observe has its credit reassigned to a fragment it can. Measurable channels look better than they are, unmeasurable ones look worthless, and budget follows the distortion.
| Cost | What it is | How it shows up in your reporting | What it actually costs you |
|---|---|---|---|
| Invisibility | Absent from AI answers where demand now forms | No record at all, because there is no log of an answer you were left out of | Demand you never got to compete for |
| Traffic | Present in the answer, but visibility no longer converts into visits | AI reads as a fraction of a percent of traffic, so it gets deprioritized | Fewer conversions, higher CPAs in the channels you over-invest in |
| Latency | The opportunity or risk signal arrives late, or never | Pipeline moves with no channel explanation | Share lost to competitors across every channel |
You cannot see an answer you were not in. This is the most expensive of the three costs and the least likely to be noticed, because there is no impression count, no lost-click report, and no zero result to investigate.
It is also zero-sum in a way the dark funnel never was. In the Similarweb journey study, the effect ran symmetrically, and when a competitor was recommended instead, the traffic went to the competitor. The visit happens either way. Being absent costs you the customer and gives that same customer to a competitor. The gap between you increases by two points, not one.
Being in the answer no longer guarantees the visit, because the surfaces that used to forward people have largely stopped. SparkToro’s analysis of Similarweb clickstream data shows 68.01% of US Google searches ending without a click between January and April 2026, up from 60.45% in 2024, with the share producing at least one click falling from 41% to 32%.
Similarweb’s 2026 GenAI Landscape report shows AI referrals flat from January 2025 to January 2026, while visits to AI platforms kept climbing. Visibility and website traffic have decoupled, which is the practical face of zero-click marketing applied to a buying journey rather than a keyword.
The damage comes from what teams do next. If AI referral reporting captures 8.8% of AI-influenced visits, then your AI search optimization strategy is being judged on less than a tenth of its effect, and it loses every budget argument against paid search, where nearly every conversion is observable. Spend migrates to measurable channels, competition there intensifies, and CPAs rise.
You pay more for demand you were already generating for free, somewhere you weren’t looking. Worse, with 55.9% of AI-influenced visits arriving through search, that demand lands on a SERP where anyone can bid against it.
If your AI mentions drop, branded search does not follow for four to seven days, and pipeline takes longer still. By the time the problem shows up in your usual reports, it has been running for weeks.
The clearest example affects SEO teams directly. A comparison page at folder depth two, earning citations and almost no direct traffic, is exactly the profile a traffic-based content audit marks for consolidation. Delete it, and your Mentions share drops weeks later in a report nobody connects back to the pruning decision.
And it compounds. The less you see, the later you act, and the more it costs to catch up. Taken together, these three are the fragmentation tax: the price of running a whole-journey model against a journey that no longer holds together.
What to do: before your next content audit or budget review, tag every page with a citation count alongside its traffic number, and require any recommendation to cut spend to carry a visibility trend line next to it. Neither takes new tooling. Both stop you from paying two of the three bills above.
METER is a measurement framework for fragmented journeys. It defines five fragments, each with its own metric and its own denominator, and one governing rule: never sum them. Every attribution model that reports a single origin for a multi-fragment journey is producing a number that cannot be true.
Mentions and Traffic have different denominators and different populations, so a dashboard that adds them is not aggregating, it is inventing. Report five numbers side by side and let the pattern between them reveal the insight.
Copy this and fill it monthly. It replaces the single-source attribution field, it does not supplement it.
| Fragment | Metric | Denominator | This month | Last month | Reading |
|---|---|---|---|---|---|
| Mentions | % of category AI responses mentioning brand | Total tracked responses | |||
| Evidence | Citations by URL, with folder depth | Total citations in prompt set | |||
| Traffic | Landing page mix, channel mix | Total sessions | |||
| Elapsed | Days to visit, branded search delta | AI-influenced cohort | |||
| Recall | Self-report plus unexplained direct or branded | Total new pipeline |
Pro tip: Use Similarweb’s MCP to populate data on the table through Claude/Manus, or any other assistant, and create scheduled reporting, always-on dashboards, and alerts.
Four of the five METER fragments happen on property you do not own, and each needs a denominator first-party analytics cannot produce: all AI responses in your category, citations across a prompt set rather than a page set, the same user seen in a conversation and then on a website, and a category baseline for what buyers report.
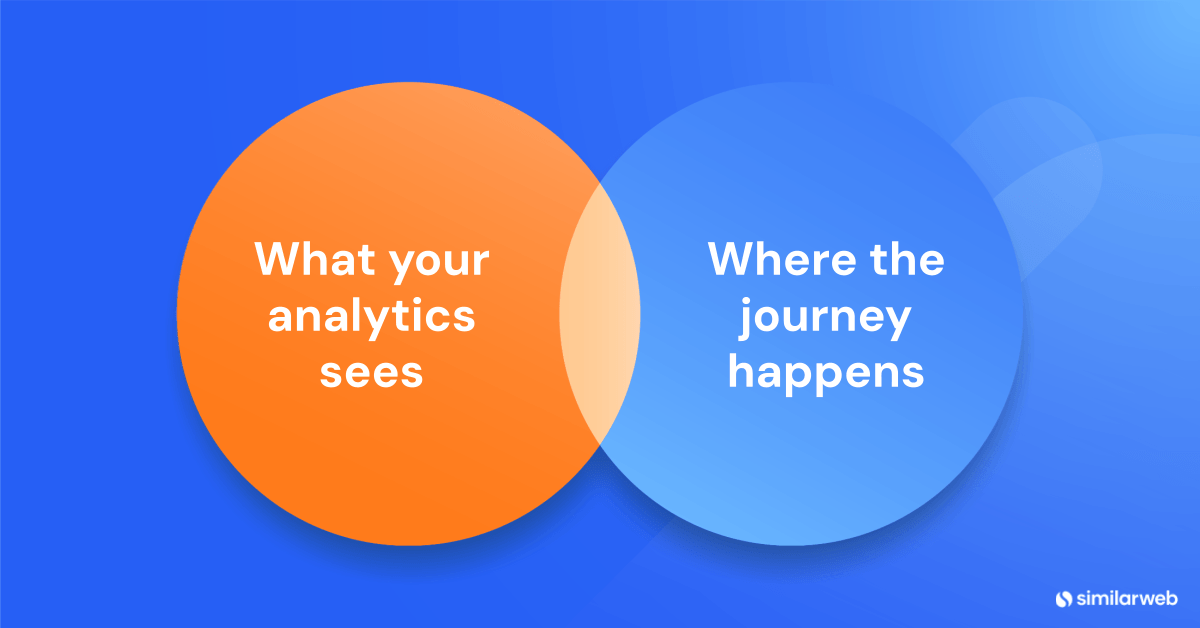
Category denominators matter for the same reason. A 30% share of mentions means one thing in a category with four credible vendors and something very different in a category with forty.
I admit (since Similarweb sells the panel I based this article on): we have a commercial interest in you concluding that market data matters. The argument stands or falls on whether four of the five fragments are observable in your own stack, which you can check in an afternoon without buying anything.
Run any source you bring in through these five questions before it enters your reporting.
| Question | Why it matters | Disqualifying answer |
|---|---|---|
| Observed or modeled? | Panel-observed behavior can support user-level journey claims. Modeled estimates cannot. | “Proprietary blend” with no methodology page |
| What is the panel size and composition? | Small or skewed panels break at category and geography level, which is where you will use them | Undisclosed, or a sample too small to segment |
| What device and geography coverage? | Desktop-only US data does not describe a mobile-first European market | Coverage not stated per metric |
| How often does it refresh, and what is the lag? | A seven-day interval effect is invisible in a monthly-refresh dataset | Monthly or slower for a daily-moving metric |
| Does it give me the competitor denominator? | Zero-sum dynamics make your numerator meaningless alone | Own-brand data only |
The competitor denominator is the question most teams skip, and the one that matters most. A dataset that reports your visibility but not the visibility of the brands being recommended instead of you cannot tell you whether you are gaining or the category is shrinking. They look identical in your own numbers and require opposite responses.
There is a sixth question worth asking: how far back the data goes? Mentions, Evidence, and Elapsed only mean anything as a trend, and a dataset that began collecting last quarter cannot show you one. Historical depth varies by years between providers, which I compared in a separate piece on historical data providers for AI search optimization.
Measuring the fragmentation tax does not reduce it. Each METER fragment has exactly one closing move, and the five are different disciplines: content for Mentions, page policy for Evidence, conversion design for Traffic, paid defense for Elapsed, and packaging for Recall. Run the move for whichever fragment moved.
| Fragment | What the metric tells you | The closing move | Who owns it |
|---|---|---|---|
| Mentions | Whether you appear in the answer | Publish structured, extractable answers in the categories where you are absent | SEO and content |
| Evidence | Which URLs are used as proof | Protect and deepen cited pages, and exempt them from traffic-based pruning | SEO and content |
| Traffic | Where humans actually arrive | Rebuild the homepage and top entry pages for a pre-informed visitor | Web and CRO |
| Elapsed | How long belief takes to become behavior | Defend branded terms in paid across the lag window | Paid search |
| Recall | What buyers say brought them | Package assets so they survive being forwarded | Product marketing |
Three of these are ordinary work you are probably already resourced for. Two are not obvious, and they have the clearest revenue mechanism.
With 55.9% of AI-influenced visits arriving through search inside roughly a seven-day window, you generate demand in a conversation you cannot see and then hand it to a results page anyone can bid on.
A competitor does not need to win the AI recommendation to win the customer. They only need to be above you when the customer searches your brand name four days later. Set a branded paid floor and hold it, particularly in the days after a visibility increase.
With 41.7% of cited URLs sitting at folder depth two and 58.8% of referral traffic landing on the homepage, proof pages will keep failing traffic-based reviews forever.
Write the exemption into your content audit criteria rather than relying on someone remembering. Any page above a citation threshold is out of scope for consolidation, and the threshold is a number you set once.
Make sure you don’t get the Traffic factor backward: Those 12.0 pageviews and 11.8 minutes are not browsing, they are verification of a decision already made, so a homepage built to explain what you do is the wrong page for someone who already knows and wants proof, pricing, and a next step. Optimize your homepage for AI traffic in order to ensure that pre-informed users have enough paths to convert.
Recall is the oldest problem here and the least likely to change with AI. Buying committees do much of their deciding in internal meetings you will never attend, and forwardable business cases, comparison summaries, and security one-pagers are how you attend by proxy.
The measurement side requires one form change: Replace “How did you hear about us” with two questions:
The second question is where AI research surfaces, because people remember consulting it even when they cannot remember which tool.
Two warnings:
Reconstructing one continuous journey from five disconnected fragments is not diligence. It is an attempt to keep using a data model that stopped describing how buying works.
What replaces it is less satisfying and more accurate. Five fragments, five metrics, five denominators, five closing moves, read as a pattern rather than summed into a total. The last of them, Recall, covers what you still cannot see. That share should be shrinking, and the fragmentation tax falls as it does.
Buyers are not hiding from you. They research where they get answers fastest, then arrive through a door they already knew about. The visit still happens, it simply arrives with no record of where it started.
If you want these fragments measured without building the tracking yourself, Similarweb AI Brand Visibility covers share of AI mentions and citation-level data across ChatGPT, Gemini, Perplexity, Google AI Mode, and AI Overviews. METER also draws on several datasets at once, and Similarweb AI Studio connects them, so you can ask a question in plain language and get the analysis, report, or dashboard back without assembling the data yourself.
Attribution used to answer “where did this come from?” It now answers “which fragment moved, and what do I do about that one?” That is a smaller question, but it can be answered and acted on.
Marketing funnel fragmentation is when one buying journey is spread across several platforms and systems, each seeing only its own part, with nothing to show those parts came from the same person. It differs from a long or complex journey, which can still be reconstructed. A fragmented journey cannot be reconstructed, because the records contain no common key. Single-source attribution therefore reports a plausible answer that is structurally incapable of being complete.
The fragmentation tax is the recurring cost of running a whole-journey attribution model against a journey that no longer holds together. It is paid in three forms: demand that forms without you in AI answers you never see, traffic that stops following visibility because presence in an answer no longer produces a click, and signals that reach you after the market has moved. None of the three appears as a line item, which is why most teams pay all three at once.
METER is a measurement framework for fragmented buying journeys. It defines five fragments, each with its own metric and its own denominator: Mentions, whether you appear in AI answers; Evidence, which of your URLs get cited as proof; Traffic, where humans actually arrive; Elapsed, how long passes between influence and visit; and Recall, what buyers say brought them. The governing rule is that the five are never summed, because they measure different populations against different denominators.
The dark funnel describes buying activity that leaves no data at all, such as a peer recommendation in a private Slack channel. A fragmented funnel describes activity that does leave data in several systems, none of which can be matched to the others. The dark funnel is a coverage problem that better instrumentation genuinely improves. Fragmentation is a connection problem that better instrumentation doesn’t address, because what is missing is the link between records rather than the records themselves.
Because AI conversations rarely end in a click. In the Downstream Impact of AI Visibility study, covering July to December 2025, 55.9% of AI-influenced visits arrived via search, 19.9% via direct, and only 8.8% via an AI referral. The user reads a recommendation, remembers the brand, and searches for it directly days later. That search carries no signal connecting it to the earlier conversation, so analytics correctly records it as branded organic and incorrectly implies search created the demand.
No, but it is useful only for the fragments it can actually see, which is on-site and paid activity. Multi-touch models distribute credit across recorded touchpoints, so any journey where the influential touch was never recorded gets its credit reassigned to whatever was. The same limitation applies across the traffic attribution models most teams run. Keep the model for channel-level budget decisions within paid and owned media. Don’t use it to answer whether AI visibility is working, because it has no input that can tell you.
Only partly. Channel grouping recovers visits that arrive carrying an AI referrer, but in the Downstream Impact of AI Visibility study, only 8.8% of AI-influenced visits arrived through a channel labeled AI. The other nine in ten came via search or direct, days later, which no referrer rule can reclaim. Capture what you can, then measure AI presence separately.
Measure presence rather than traffic. Track the share of AI responses in your category that mention your brand, the specific URLs cited as evidence, and the movement in branded search volume in the days following a visibility change. Together, these three give you a defensible read on whether AI is generating demand, without requiring a referral header that, in most cases, will never exist.
Director of SEO & AI Search at Similarweb
Limor brings 20 years of expertise in SEO and AI Search. She thrives on solving complex problems, creating scalable strategies, and building amazing dashboards.
The Best AI Citation Analysis Tools in 2026

Should You Add A TL;DR to Your Blog Posts To Help You Get Cited By AI?
Claude vs. ChatGPT: What 2026 Usage Data Says About Which AI to Pick
Give it a try or talk to our insights team — don’t worry, it’s free!