Marketing Funnel Fragmentation: Why AI Broke Attribution
by Limor Barenholtz20 Min.
Sep 17, 2026
Historical data is what makes SEO analysis, forecasting, and strategy possible. Not better tooling, not smarter analysts. Longer, wider, accurate, granular records. Almost every judgment I make as an SEO director depends on one thing: what the data says.
None of those can be answered from a snapshot. All of them are answered by comparing now to a documented then.
The same questions are now being asked about AI search performance by the same executives, and almost none of the record needed to answer them exists. Which is why historical data now shows up in two different pitches: from the AI search optimization platforms that launched into this market, and from the measurement companies that were collecting behavior long before it existed.
Those are not the same product. On the platform side, the history is usually thin: short windows, single daily samples, numbers nobody could reproduce. On the measurement side, there are years of it, but the sampling may never have covered your category. Neither difference shows up on a pricing page, which is why the question isn’t whether a company can sell you historical data. It is whether it was collecting before you arrived.
In this article, I cover what counts as historical data in AI search, what can and cannot be recovered after the fact, the leading providers and how far back each one really reaches, how to choose between them, how to combine them into a baseline, and which metrics still mean anything after you switch.
Eight companies sell historical data for AI search: Similarweb, Comscore, Datos, DataForSEO, Profound, Cloudflare, Kantar, and NIQ. Their AI records start anywhere from late 2023 to 2026. Similarweb’s reaches back to January 2024, at both brand and market level. Every tracker you configure today starts today.
Historical data is a record of what happened during periods before you started looking. That last clause is the whole definition and the whole problem. A dataset that begins on the day you became a customer is not a history of your category, but a log of your subscription.
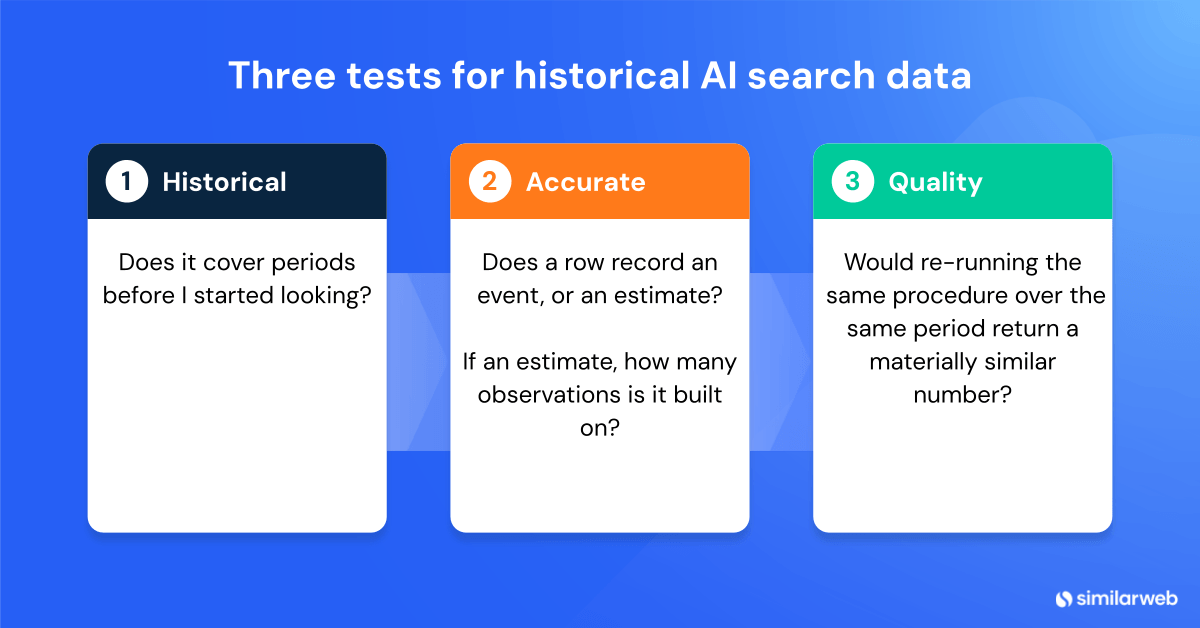
Three tests separate one from the other:
| Property | The test | Fails when |
|---|---|---|
| Historical | Does it cover periods before I started looking? | Collection begins at signup |
| Accurate | Does a row record an event, or an estimate? If an estimate, how many observations is it built on? | A daily figure rests on a single run of a single prompt |
| Quality | Would re-running the same procedure over the same period return a materially similar number? | Variance between runs exceeds the change being measured |
Run a prompt once a day and plot the result, and you have drawn a line through thirty coin flips. Run it enough times across enough prompts, and the noise averages into an estimate with a knowable margin of error. So “how often does it run, and across how many prompts” is a more revealing question than “how far back does it go.”
Depth without sample size is a chart of noise, and a long one is worse than a short one, because it looks authoritative.
One rule governs all of it: data can be recovered later only if somebody was sampling it at the time. Everything else follows from that, including why a provider who was already sampling can sell you three years of a category you never tracked, while the most expensive platform you can buy cannot give you last week if you signed up yesterday.
An AI answer is generated only when requested, and stored nowhere publicly. If nobody ever ran a given prompt, no product and no budget can produce what an engine would have said in response to it last March.
Re-asking today returns a different answer from a different model on different retrieved sources, which is a new observation, not a recovered one.
Answers that were being sampled at the time are retrievable (even if the sampling was never tied to your account). Similarweb and Comscore have been collecting generative AI search data before anyone asked for it.
What is recoverable goes further than a trend line. Where sampling was already running, the record can include the prompt, the answer it returned, the sources cited inside that answer, and the sentiment, day by day. Clickstream capture of real user conversations adds a second layer that never depended on anyone’s campaign.
Which of those layers you can actually get depends on the provider, and that is the next section.
So the question to ask a provider is not “does your data go back?” It is “was my category in your sampled set at the time, and can I have that period?”
For a mainstream category, the answer is often yes. For a narrow niche nobody was sampling, the honest answer is no. A vendor who says otherwise is estimating what the answers probably were, which is a different product from showing you what they actually were.
Everything below is a data company rather than a tool. Seven of them sell their data, and one publishes it for free, but in every case the dataset exists independently of you. That is the filter, and it removes most of what usually appears in a roundup like this.
A dataset a vendor was already collecting can be sold to you retroactively. A tool that starts logging your own property when somebody at your company switches it on cannot, no matter how far its retention window stretches.
Eight companies qualify. They are ordered by how much of an AI search optimization question each one can actually answer, from full AI answer records through single-purpose panels to the two that hold almost no AI data at all. Those last two are a finding about the category, not a reason to leave them out.
| Provider | What it sells | AI data, and how far back | Cost |
|---|---|---|---|
| Similarweb | Digital data via platform, Datahub, API, and Data for AI Training | AI search tracking at brand and market level since January 2024, AI referral clickstream from seven platforms, Web intelligence (traffic, keywords, competitors, etc.) history starting in 2018 | Paid, from $99/mo |
| Comscore | Panel-based digital, TV, and cross-platform audience measurement | Generative AI search since May 2023, plus a prompts and responses layer | Not published |
| Datos | Anonymized clickstream licensed as event-level datasets | Behavioral Index history to 2020 for web traffic, no published AI start date, and prompt database holds 317M+ prompts refreshed monthly | Not published |
| DataForSEO | Raw SEO and AI data as an API | Mentions and citations across ChatGPT and Google AI Overviews back to August 2025, with AI search volume. No prompt-level data, no sentiment, no referral traffic | Pay as you go, from $1.10 per 1,000 rows |
| Profound | Consumer prompt panel, plus a citation tracker | Prompt Volumes predates your account. Brand citation tracking holds nothing before signup | Not published |
| Cloudflare | Aggregate network and web telemetry | AI bot and crawler traffic since September 2024, with crawl-to-refer ratios added July 2025. Aggregate web only, nothing brand-level | Free, public API |
| Kantar | Brand equity, consumer panels and digital analytics | Generative AI Brand Tracker across AI Overviews, ChatGPT, Gemini, Copilot and Perplexity, measuring share of response, themes and sentiment. No start date or historical reach published | Not published |
| NIQ | Retail measurement, 220M+ product items, 90+ countries | Survey-based agentic commerce tracker from early 2026, roughly 500 US consumers monthly. Buying the generative AI layer from Similarweb, starting Q4 2026 | Not published |
Similarweb holds historical AI search data back to January 2024. The record is a continuous, detailed sampling of AI answers: the prompts people asked, the brands mentioned in the responses, the exact URLs cited as sources, and the sentiment of each mention, across ChatGPT, AI Mode, AI Overviews, Gemini, and Perplexity.
Around it sits clickstream capture of real AI referral behavior from seven platforms, plus Web Intelligence data (traffic, keywords, ranking, and competitors) reaching back to 2018.
Those records are also sold as raw data, which is the clearest evidence of what they actually are. Similarweb’s Data for AI Training includes digital behavior across search, web traffic, app usage, ecommerce product performance, and technographics, delivered as bulk JSON, CSV, or Parquet, as a real-time API, or as a cloud feed, with commercial training rights attached rather than scraped provenance.
The same data is licensed to companies building large language models. Perplexity embedded Similarweb data into Perplexity Computer in June 2026, and Bloomberg selected Similarweb as its premium alternative data provider of digital performance metrics on the Terminal in February 2026.
Which route you choose depends on how you want to work:
Inside the platform, that data surfaces as the AI Research suite, the exception to almost everything in this category.
AI Brand research takes a brand and its competitors and returns the AI topical landscape retroactively: which topics are trending, which are declining, which brands get mentioned inside each one, and which sources feed them. No campaign, one domain input, and the history is there.
AI Industry research needs no brand at all. Pick a sector and sub-sector, and you get the same history for the whole market: topics ranked by volume, their month-over-month movement, their trend lines, and the brands AI names inside them.
Four counters sit above it:
“First time this month”, for example, is a metric that can only exist if somebody has been watching continuously, because you cannot identify a new topic without a record of which topics are old.
Underneath the topical view sits the prompt-level layer: the prompts people actually asked, whether you were mentioned in the answer, the domains and exact URLs the engine used as sources, and the sentiment of each mention, across ChatGPT, AI Mode, AI Overviews, Gemini, and Perplexity.
Then AI referral traffic by platform, showing what those mentions actually sent you, and below that, keyword and SERP feature history with zero-click rates for any domain, which tells you how much of a query’s demand was already being absorbed before an answer engine arrived, and so whether AI took your clicks or something else did. The API documentation sets out the historical coverage available for each dataset type.
A third outlet of their data is free. The same sampling sits behind the published research and the free tools:
All are free to use and the fastest way to get a category benchmark that predates your own tracking.
Best for: retroactive category context, AI competitor analysis predating your interest, AI referral trends, campaign-free topical history for a brand and its rivals, and answer-level history for categories that were already in the sampled set.
Limitation: retroactive coverage depends on whether your category was sampled at the time, so a narrow niche may have less history than a mainstream one. Depth also varies by dataset rather than being uniform across all of them.
Comscore is a panel company most SEO teams never consider. It announced in November 2023 that its syndicated qSearch product had been collecting generative AI search since May 2023, when the first platforms reached consumer scale.
The collection sits on a person-based opt-in panel covering desktop and mobile, which means it measures observed behavior rather than modeled estimates. The AI capability arrived in layers. AI tool visitation covering 117 AI tools and features across nine categories on PC and mobile was added in May 2025. A flag recording whether a Google AI Overview or Bing Copilot answer was present at query and at click, plus a prompts-and-responses layer including cited domains, came later still.
The published output shows the granularity. Comscore’s Q1 2026 AI Intelligence Report puts ChatGPT at 244 million desktop conversations in March 2026, records average prompts per conversation of 4.9 on ChatGPT, 4.6 on Gemini and 7.1 on Copilot, and reports that AI Overviews appeared alongside 46% of paid search ads in consumer credit cards in Q4 2025, up from 21% in Q2 2025.
Best for: teams whose media buying already runs on Comscore’s syndicated measurement.
Limitation: no brand visibility workflow, and no answer-level record of how your brand was described. The prompt and citation layer arrived well after the 2023 query series, so the depth applies to search-market volumes rather than to anything about you. Media-agency pricing and no self-serve tier.
Datos is a clickstream data provider and a Semrush (now Adobe) company, making it the closest structural comparison to Similarweb on this list: a panel that recorded behavior long before AI search became a category anyone budgeted for. Its own description of the business is licensing anonymized, privacy-secured datasets covering desktop and mobile browsing for tens of millions of users, sold as event-level daily feeds rather than as reports.
Datos licenses its Behavioral Index through Exabel, an alternative data platform for institutional investors, which states the dataset carries history back to 2020 for backtesting. That covers web traffic. For AI search specifically, Datos publishes no start date.
The AI-specific prompt layer belongs to Semrush rather than to Datos: a database of 317M+ prompts and responses across ChatGPT, Gemini, AI Overviews, and AI Mode, refreshed monthly, sourced from AI search and Google’s keyword data.
Best for: raw event-level clickstream licensed as a dataset, for teams that want to model browsing behavior themselves rather than read someone else’s dashboard.
Limitation: Datos sells behavior, not answers, so there is no record of what an AI engine said about your brand. The AI-answer layer sits with Semrush, which is explicit that its traffic figures are modeled from clickstream rather than measured, and its Brand Performance reports run on synthetic prompts generated from your domain and location rather than on prompts anyone actually submitted.
Sells AI visibility data purely as an API, with no interface wrapped around it. The LLM Mentions API returns mentions and citations for any brand, domain, or keyword across ChatGPT and Google AI Overviews, with three historical endpoints: month-by-month counts, period-over-period deltas, and newly gained or lost mentions. Pricing is usage-based with no seat license, making it a cheap way to run competitor mention history at scale.
Its historical floor is August 1, 2025. That is real history and considerably more than a campaign gives you, though it covers under a third of the AI search record available elsewhere on this list, and it starts after AI referral traffic had already been reshaping categories for a year.
Best for: teams with engineering capacity who want access to mention history as raw data to model against, rather than a dashboard someone else designed.
Limitation: an API with no interface, so it is a build rather than a purchase. ChatGPT historical coverage is United States and English only. It focuses on mentions and citations rather than referral behavior, so it tells you where you appeared, not what it sent you.
Profound sells prompt volume data drawn from a consumer conversation panel, alongside citation tracking across 10+ engines. Prompts are re-run daily, and each answer is stored as a full snapshot rather than averaged.
Profound shows you nothing about your own brand from before you signed up. The citation tracking starts the day you configure your prompts. Prompt Volumes was collected earlier, but it reports market-level prompt demand, not how your brand appeared in answers. Profound publishes no retention figure and no start date, so any depth number you see attached to it describes how long your own archive is kept rather than how far back the data reaches.
Best for: market-level prompt demand, which is the one part of the product that predates your account.
Limitation: enterprise pricing with no self-serve tier and API access only on the top plan, so it is a procurement cycle rather than a purchase. Get the storage limit in writing before you sign (it is tier-dependent and unpublished). The citation archive begins the day your account does, but it’s unclear how long they keep it.
Free, public data on AI bot and crawler traffic across a large slice of the web. Cloudflare launched the AI bot and crawler traffic graph in September 2024 on Radar’s Traffic page, then expanded it into a dedicated AI Insights section with a public API. The crawl-to-refer ratio is the standout metric, dividing the pages a platform crawls by the visitors it refers back, and it arrived in July 2025 rather than with the original graph.
Best for: benchmarking your own server logs against the wider web. Knowing whether a crawler treats your site unusually requires knowing how it treats everyone else, and this is the only free way to make that comparison.
Limitation: aggregate web data, not your site, and it measures crawler behavior rather than answers, so it tells you nothing about what an engine actually said. The Radar interface also caps custom date ranges at one year, so longer comparisons require the API.
Kantar sells brand equity and consumer panel data at significant scale, and its AI offering is a tracker. The Generative AI Brand Tracker covers several AI engines, measuring how often and how prominently a brand appears, with what sentiment, and which sources the platforms drew from. It then runs that through Kantar’s Meaningful Different Salient and NeedScope frameworks, tying AI visibility to their brand equity models.
The product page states no start date, no historical reach, no run frequency, and no sample size. It does state that dashboards are customized by market, category, or question, which is the mechanical reason there is no history: the questions are yours, so the record begins when you define them. Kantar Digital Analytics includes AI search among its feeds, again without published depth.
Best for: connecting AI visibility to brand equity measurement, useful if brand health tracking is already a Kantar contract.
Limitation: on this article’s question, it behaves like every other tracker. Ask for the collection start date in writing before you sign, because the published material does not contain one.
NIQ is a data company by any definition: a product catalog of 220M+ items enriched with 9B+ attributes, operations in more than 90 countries, coverage of roughly 82% of the world’s population and $7.4 trillion in tracked consumer spend. It holds decades of purchase history. It holds almost no AI search history.
Its AI data is a monthly agentic commerce tracker surveying roughly 500 US consumers, running since early 2026, which found that 42% had used at least one AI tool to shop in the past month. That is stated preference collected this year, not observed behavior collected continuously.
What NIQ did next matters more than the tracker. On September 2, 2026 it announced a collaboration with Similarweb to add “visibility into AI-driven consumer behavior inside generative AI platforms,” with an initial version due in Q4 2026. NIQ’s own announcement concedes that across the industry, the data and measurement required for this shift remain incomplete.
Best for: connecting AI-influenced discovery to verified sales, once it exists.
Limitation: there is no historical AI record to buy today. A company with this much measurement infrastructure had to go and license the AI layer, which tells you how few places that layer exists.
Start from the question you need answered rather than the feature list. Three things decide which sources you end up with: whose data you need, what kind of question you are asking, and how much technical lift you can absorb.
Whose data? Category and competitor history is what you actually pay for, because nobody hands that over. You already have your own property’s record, so start every question by asking whether it needs an outside dataset at all.
What kind of question? “Did it happen” questions are answered by events: visits, impressions, positions, crawls. “How was I talked about” questions are answered by sampled answers. The two come from different collection methods, and no single source does both well.
Technical lift. The same data is available through an interface, a scheduled export, an API, or a raw corpus you process yourself. Pick the lowest rung that answers your question, because the higher ones cost time you may not have.
| If you need to know | Start with | Then add |
|---|---|---|
| How AI search behaved at market level | Similarweb AI Industry research and the GenAI reports | Comscore qSearch for pre-2024 query volumes |
| Where I stand against competitors, historically | Similarweb AI visibility and citation data | Keyword and SERP history for the pre-AI baseline |
| Whether the category moved or only I did | Similarweb Brand Research topic trends | Similarweb AI Industry research for the sector view |
| How AI referral behavior shifted across a whole market | Datos referral traffic | Similarweb AI referral traffic |
| How ads are showing up inside AI answers | Similarweb ChatGPT Ads Report | Similarweb AI Ads for live placements and creatives |
| Mention history I can model against, not a dashboard | DataForSEO | Similarweb for depth beyond August 2025 |
| How much demand a prompt actually has before I chase it | Profound prompt volumes | Similarweb Brand Research topic trends |
| Whether AI visibility is moving brand equity | Kantar Brand Tracker | Your own brand tracking baseline |
| Whether AI crawlers treat my site normally | Cloudflare Radar | Similarweb Site Audit server log analysis |
| Whether AI discovery converted to verified sales | NIQ, from Q4 2026 | Similarweb, from Q1 2027 |
None of these is a substitute for your own analytics. Search Console and Bing Webmaster Tools aren’t on this list because they hold your property’s data from whenever somebody at your company switched them on, which isn’t history. They are still where you go to check whether a vendor’s numbers survive contact with reality, which is the whole point of the O in the test below.
Once you have a shortlist, every claim about historical depth reduces to five questions, and all five are about time: when collection started for your account, how the rows were produced, whether anything can be cross-checked, whether the series has gaps, and whether the method is documented.
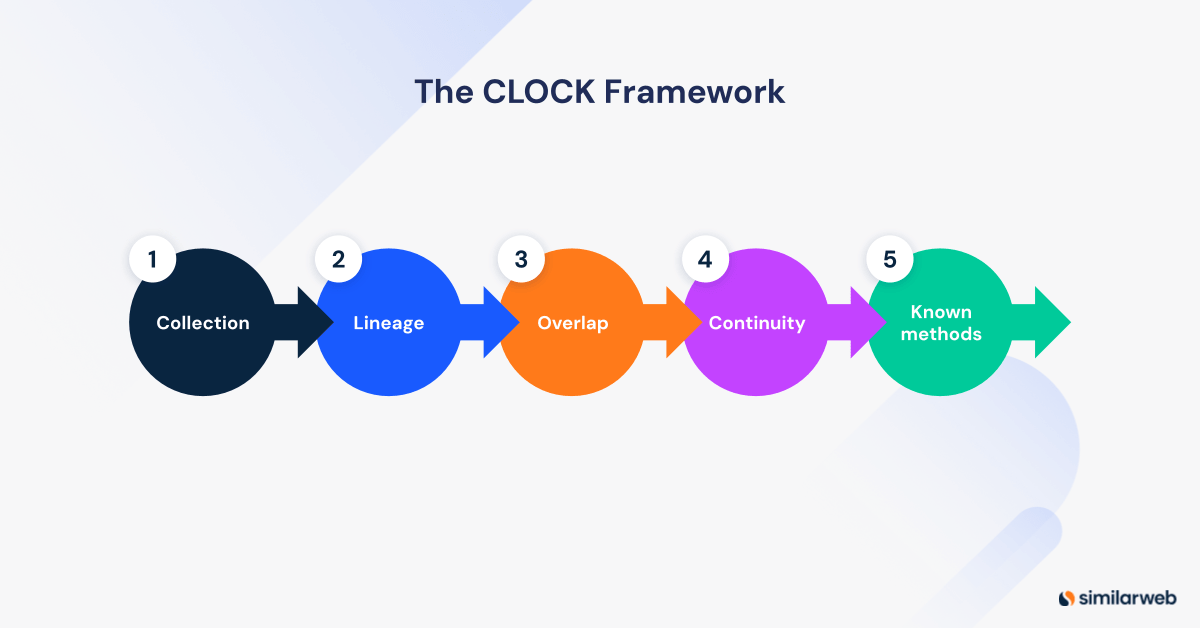
| Question | Answer that should worry you | |
|---|---|---|
| C | Collection start: when does my data begin? | A demo showing twelve months of someone else’s data |
| L | Lineage: does a row record an event, or an answer the system received when it asked? | “Our AI models analyze the data” |
| O | Overlap: can any of this be validated against a source I already hold? | A metric that cross-checks against nothing |
| C | Continuity: are there gaps, and are they documented? | A perfectly smooth line with no annotations |
| K | Known method: are prompt counts, run frequency, and engine list published? | “Proprietary” |
A provider can fail K and still be worth buying. A provider that fails C without telling you has sold you a chart, not a dataset.
A working baseline pairs one retroactive source with one forward one, then validates both against first-party data. In practice, that means keyword and referral history for the period before you started, prompt tracking running from today, and your own first-party analytics confirming they agree. If you are starting from nothing, this order loses the least:
| Step | Action | Why now |
|---|---|---|
| 1 | Add category keywords to rank tracking | You only get AI Overview presence from the day a keyword is added, never before |
| 2 | Configure prompt tracking with prompts built from observed data rather than keyword templates | Grounded prompts make month one useful instead of exploratory |
| 3 | Pull keyword, SERP feature, web and AI referral history for you and your competitors | Retroactive, so no urgency penalty, and it sets the baseline |
| 4 | Start a monthly export of your own search analytics | First-party retention windows shorten by a day every day, and what ages out is gone |
| 5 | Record the configuration date and prompt set in writing | Every future comparison depends on knowing when collection started and what changed |
Steps 1, 2, 4 and 5 lose something by waiting. Step 3 does not, which is precisely what makes it historical: it will still be there next month, and next year.
Step 5 is the one people skip and the one that causes the most trouble later. A prompt set edited in month four silently breaks every trend line crossing it. Similarweb’s prompt analytics generates prompts from observed prompt data rather than keyword templates, which reduces how often you will need to make that edit.
Some AI visibility metrics are portable across data sources, and some are artifacts of one collection method. AI Share of voice, mention share, citation share, and what some vendors call share of model or share of response are all ratios computed over a prompt set. Referral visits, impressions, and positions count events that either happened or did not. Only the second group means the same thing after you switch vendors.
Change the prompt set, the engine mix, or the run frequency and share of voice moves without anything changing in the world. That makes these numbers useful for tracking yourself against yourself over a fixed prompt set, and close to meaningless as a cross-vendor comparison or an industry benchmark. Two brands quoting share-of-voice figures from different tools are not always in conflict, since they are measuring different things.
Referral visits from AI platforms, whether a tracked keyword triggered an AI Overview, conversion rate on AI-referred traffic, and the search impressions and positions underneath them. These count events, so two systems measuring the same period should broadly agree, and where they diverge, you can usually explain why.
Portable does not mean infallible. Google’s data anomalies page records a logging error that inflated Search Console impressions, click-through rate, and average position from May 2025 to April 2026 while leaving clicks untouched. An event metric is only as reliable as the system counting it, and clicks survived that failure where impressions did not.
The practical rule: never report a non-portable metric without also reporting the prompt set and date range it was computed over, and never compare one across providers. If a number would change when you change tools, it belongs in your internal trend view, not in a board deck. Our breakdown of GEO KPIs sets out which belongs where.
The market sells depth because depth is easy to put on a slide. The question that separates these providers isn’t how far back the chart goes, but whether the data behind it was collected before you arrived.
By that test, the list is short, and the ranking doesn’t match the price tags. The campaign you configure today will have the shortest history of anything you buy, and it will still have the shortest history a year from now.
Similarweb’s AI record here runs back to January 2024, at brand and market level, and it never required a campaign. Most teams assume the answer to “what do we have from before we started” is nothing. It is usually more than nothing, and it is sometimes already paid for under a different contract.
So do both, and in this order. Configure the forward tracking first, because that record begins the day you set it up and not a day earlier. Then go looking for what already exists: your own analytics, the free published research, and the datasets sitting inside contracts your company may already hold. Between them, you can usually reconstruct a year you assumed was gone. The only period nobody can sell you is one nobody was sampling.
The AI Brand Visibility tracker monitors prompts, mentions, citations, and sentiment across the major engines from the day you turn it on.
A campaign begins collecting when you configure it, but that is only one route. Similarweb’s AI data history reaches back to January 2024, and Brand Research returns it for any brand and its competitors with no campaign attached. AI Industry research does the same for a whole sector without naming a brand at all. The limit is whether your category was being sampled at the time, not whether you were a customer then.
One. Cloudflare Radar publishes AI bot and crawler data with crawl-to-refer ratios back to September 2024 through a free public API, though it is aggregate web data rather than anything brand-level. Google Search Console and Bing Webmaster Tools are free but aren’t data providers: they hold your property’s record from when it was verified, so they validate a vendor’s numbers rather than supplying history you didn’t have.
It depends on which question you are answering. Similarweb holds the deepest AI visibility record, back to January 2024, covering a brand’s AI topical landscape, whole-sector topic history with no brand required, and AI referral history for competitors as well as your own domain. Datos licenses clickstream with a behavioral record reaching back to 2020, DataForSEO sells mention history as a raw API back to August 2025, Comscore holds AI search query volumes inside a media measurement panel, Profound holds prompt demand from a consumer panel, and Cloudflare Radar covers AI crawler behavior for free. Kantar and NIQ sell enormous datasets with almost no AI history in them yet.
Any prompt-tracking platform will chart trends across the period it has been running for you, which is why the useful question is when your collection started rather than which vendor you picked. For trend analysis reaching further back than your own contract, you need a dataset that was already running. Similarweb’s Brand Research does this campaign-free for a brand and its competitors back to January 2024, and AI Industry research returns the same history for an entire sector.
Citation history depends entirely on when sampling started. Similarweb holds cited domains and exact cited URLs back to January 2024 across ChatGPT, AI Mode, AI Overviews, Gemini, and Perplexity. DataForSEO returns mentions and citations as an API back to August 1, 2025. Every other AEO platform on this list begins its citation record the day you configure a campaign, which means the archive is yours rather than the category’s.
Similarweb’s AI search tracking reaches back to January 2024, with web intelligence (traffic, keywords, competitors, etc.) going back to 2018. Comscore’s generative AI search collection begins in May 2023. Datos licenses a behavioral record back to 2020, though that covers web traffic rather than AI answers. DataForSEO’s LLM mention history begins August 1, 2025. Profound’s consumer panel predates your account, but its brand citation tracking holds nothing from before signup. Cloudflare Radar’s AI bot data goes back to September 2024, with crawl-to-refer ratios from July 2025. Kantar publishes no start date, and NIQ’s AI tracker starts in early 2026.
Only where somebody was sampling at the time. A generated response exists solely at the moment of the request and leaves no persistent public trace, unlike a ranking, a backlink, or a page, and re-asking today produces a new observation rather than a recovered one. So a prompt nobody ever ran has no past that can be bought. A category that a provider was already sampling can be opened up retroactively, which is why asking “was my category in your sampled set” matters more than asking how far the charts go.
It depends on what you are asking. A year-over-year comparison needs twenty-four consecutive months, arithmetically. Seasonality needs at least twelve to see a full cycle. Direction needs enough runs for the trend to clear the variance between them, which in practice most teams put at around a quarter. This is the strongest argument for retroactive sources: they hand you the twelve- and twenty-four-month views immediately, while a new campaign takes a year to reach the first.
Combine a retroactive source with a forward one and validate both against first-party data. Keyword, SERP, and AI referral history give you category context predating your campaign. Rank tracking records AI Overview presence only from the day a keyword is added. Your own first-party analytics confirm whether any of it matches your clicks, which held up through Google’s impression logging error where impressions did not. None of this replaces prompt history you did not collect, but together they produce a defensible starting point rather than a blank chart.
More than one per day, which is what many charts are built on. A single run is one draw from a distribution, so a day-to-day movement usually reflects variance rather than performance. Ask any provider for run frequency and prompt count, then check whether the change you are looking at is larger than the variation between runs. If it is not, you are reading noise.
Director of SEO & AI Search at Similarweb
Limor brings 20 years of expertise in SEO and AI Search. She thrives on solving complex problems, creating scalable strategies, and building amazing dashboards.
Give it a try or talk to our insights team — don’t worry, it’s free!