
What is RAG (Retrieval-Augmented Generation)? A Marketer's Guide
by Shai Belinsky9 Min.
Oct 01, 2026

When I first started optimizing for generative AI, it became clear that traditional SEO analyses and tactics no longer cover everything I need to know to achieve sustainable organic growth.
AI engines now answer questions directly and cite only a few sources. Zero‑click searches rose from 56% to 69% after Google rolled out AI Overviews, and fewer than 20% of searchers click an external link, dropping below 4% in AI mode.
Consumer behavior is changing too: the Capgemini Research Institute reports that nearly one in four consumers already shop with generative AI, and about 60% have replaced search engines with AI tools for product recommendations.
In short, generative AI engines are now a significant gateway to my brand, so I have to monitor and optimize for traffic and visibility within them.
AI citations can be fickle: Only 11% of domains overlap between ChatGPT and Perplexity, and half of all cited domains change monthly, but they’re not beyond SEO’s influence. Because of this volatility and opportunity, I created a guide for analyzing AI citations.
The next step is performing a citation gap analysis.
In this guide, I’ll use Similarweb’s AI brand visibility tools, with PayPal data as an example, to show how to compare a brand’s citation footprint with competitors, identify the topics and domains with the most influence, and discover where others are outperforming it.
AI citation gap analysis is the process of systematically measuring how often, where, and in what context your brand is cited in AI-generated answers compared with your competitors, across key topics, domains, and URLs.
Instead of just asking “Does my brand show up in AI results?”, I break visibility down into concrete layers:
By quantifying these patterns (brand vs. non-brand answers, share of citations, domain influence, and URL-level impact), I can see exactly where rivals are winning visibility that I’m not, identify missed opportunities with influential sites, and turn those gaps into a clear roadmap for outreach, content updates, and partnerships that improve my brand’s presence in generative AI engines.
In many queries, the AI answer encompasses the entire user experience, so visibility is measured by citations rather than ranking.
Similarweb’s researchers analyzed 24,000 conversations and 65,000 responses across ChatGPT, Perplexity, and Google and found that these systems foreground only selected sources, with news citations concentrated among a few outlets.
If a brand isn’t among those trusted sources, AI search won’t mention it.
Yext’s 2025 study shows that 86% of AI citations come from brand‑controlled sources: 44% from brand-owned web assets and 42% from listings, while forums like Reddit contribute just 2%.
Citation patterns vary with intent: objective questions lean on first‑party sites and local pages, whereas branded or subjective queries pull more from listings and reviews.
Comparing citations by domain, topic, and URL reveals hidden strengths and weaknesses. A PayPal competitor might dominate ‘digital wallets’ while it leads in ‘money transfers’.
Understanding those differences helps prioritize resources.
Once brands know which high‑influence domains cite their competitors, they can build relationships or produce content that fills those gaps, turning missed opportunities into visibility.
More than half of U.S. consumers use AI engines weekly, yet 64% of marketing leaders are unsure how to measure success in AI search, and 72% expect AI search to affect acquisition more than traditional SEO within three years.
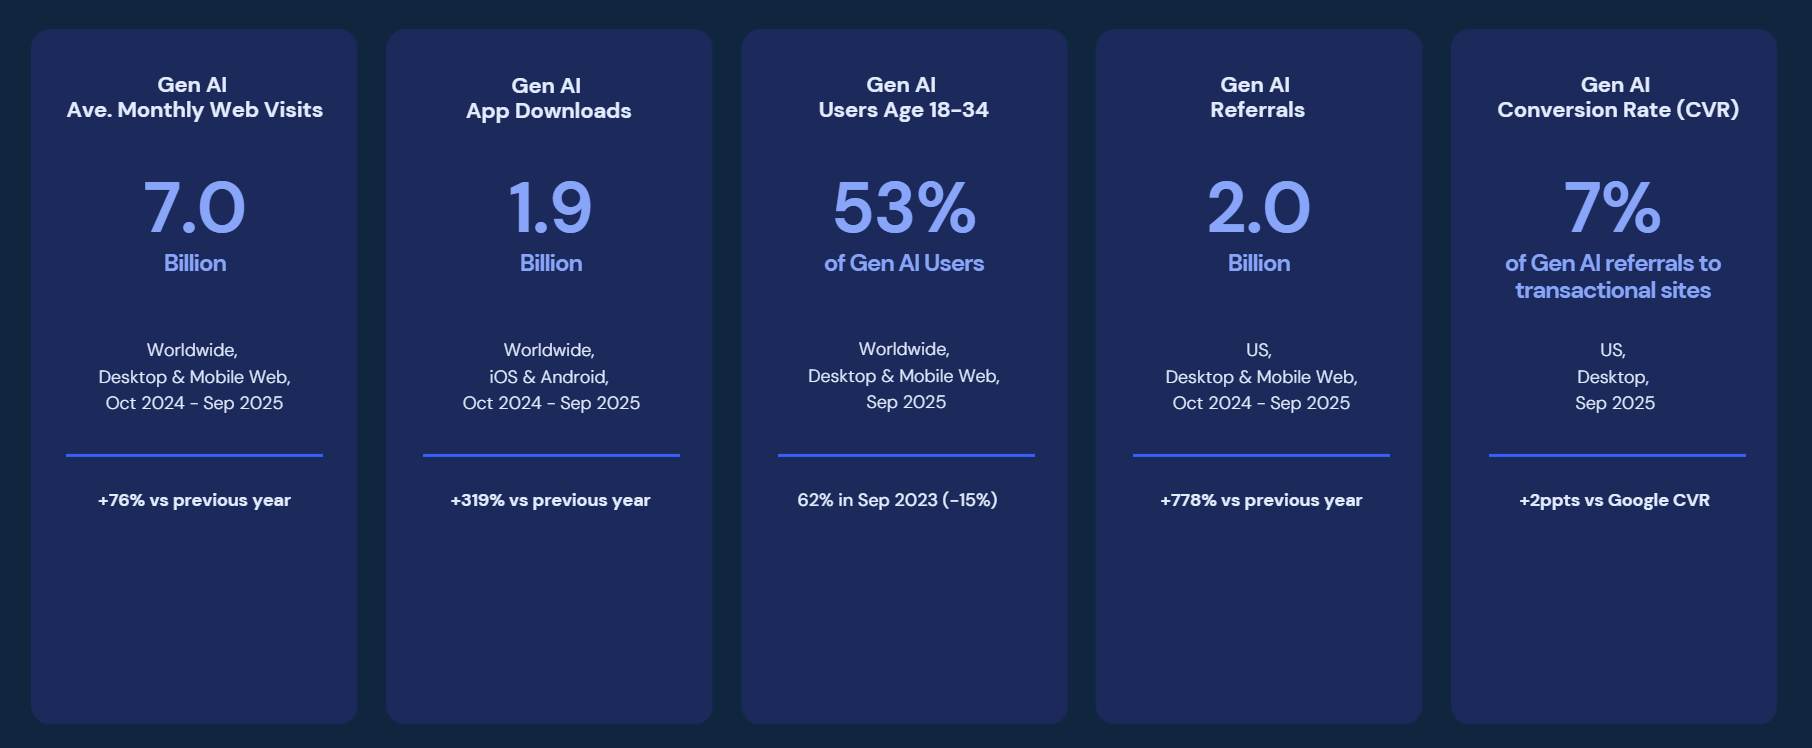
According to Similarweb’s 2025 Gen AI Landscape Report, monthly traffic to Gen AI websites grew by 76% Year over year to 7 billion visits. The same research also shows that Generative AI conversion rates are higher than Google’s, indicating that the traffic AI sends to websites is highly aligned with user intent and can be highly valuable.
Brands that start monitoring citations now will get ahead of the competition.
I like to break citation gap analysis into four phases using the D.E.E.P. framework:
Clarify which topics and prompts are most relevant to my business, what success looks like (e.g., increased citations, higher domain influence scores), and who my key competitors are. Without a clear scope, the analysis becomes unfocused.
Use Similarweb’s AI Brand Visibility features to view all citations across my topics, identify which domains are trusted, and categorize them. This exploratory phase helps benchmark my brand’s status.
Drill down into topics, domains, and URLs to quantify where competitors are outperforming me. Compare my site to competitors, analyze the influence scores of cited domains and URLs, and note which website categories (news, reviews, etc.) dominate.
Develop an action plan to close gaps. Decide where to create or optimize content, build partnerships or PR, add structured data, and monitor progress. Closing citation gaps is a continuous process, not a one‑off task.
Throughout this guide, I’ll refer back to these phases to show how the framework translates into concrete steps.
Before analyzing gaps, I’ll define what success looks like. For PayPal, my key questions are:
I’ll use Similarweb’s AI Brand Visibility tool to answer each question.
In the Brand Overview tab, I see the top‑level metrics: Brand Visibility and Brand Mention Share. These metrics answer my first question about overall visibility vs competitors.
Brand visibility measures the percentage of answers that mention my brand in AI search among all answers across tracked topics.
In my example, PayPal’s brand visibility is 45.71%, meaning it is mentioned in 576 of 1,260 answers over the last seven days.
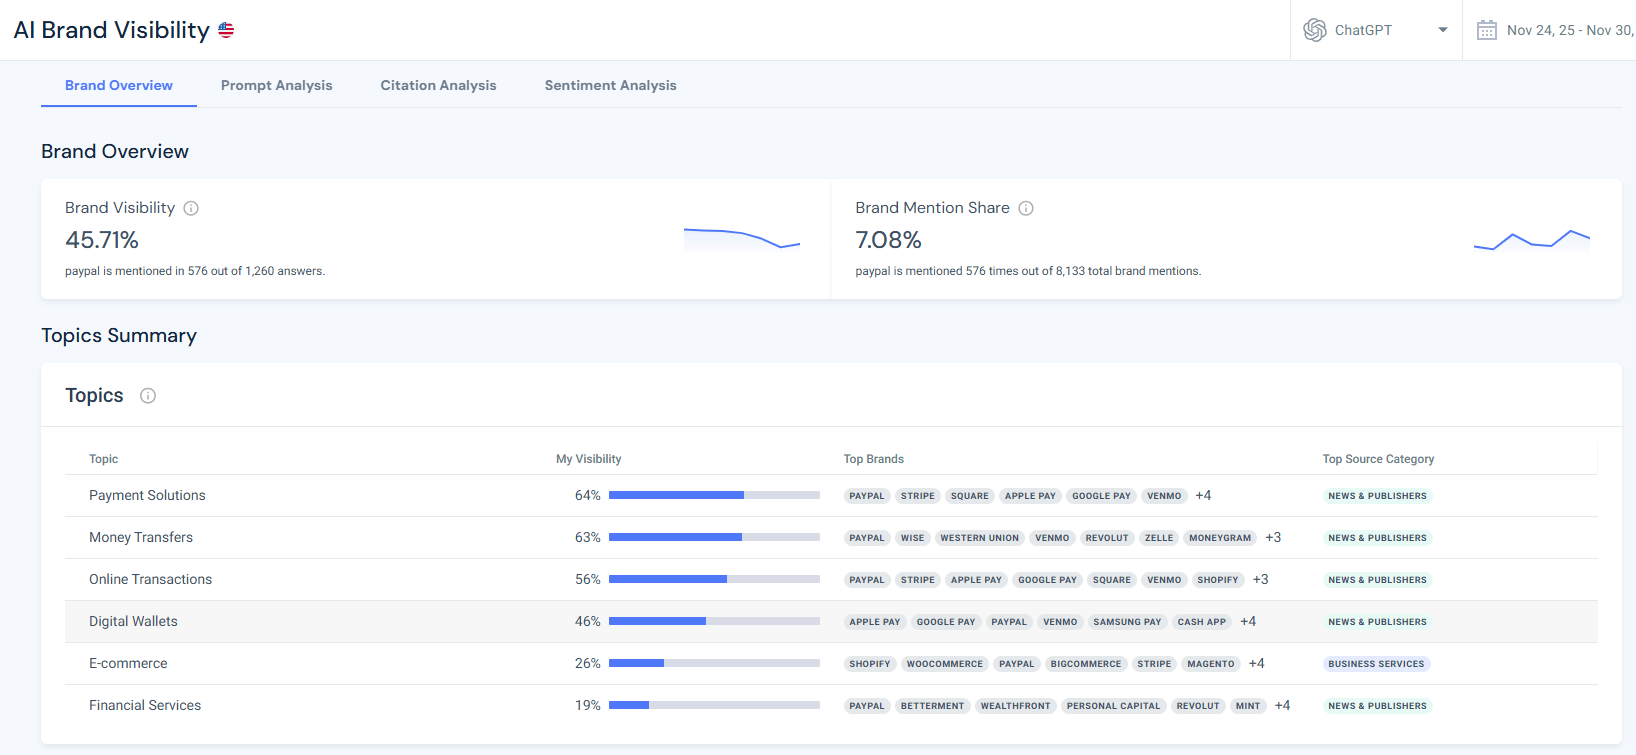
Brand visibility is a primary benchmark because it reflects how frequently AI models bring my brand into the conversation.
Brand mention share measures the percentage of my brand’s mentions out of all brand mentions. PayPal’s share is 7.08%, representing 576 mentions out of 8,133 total brand mentions.
This metric reflects relative exposure: a high visibility but low share may indicate a crowded space with many other brands.
Scroll down to the Competitors section and observe the Brands’ visibility chart. It shows visibility percentages for PayPal and competitors across All Topics.
In my 7-day sample, the numbers were as follows:
| Brand | Visibility (%) |
| PayPal | 46 |
| Apple Pay | 26 |
| Google Pay | 23 |
| Stripe | 22 |
| Venmo | 19 |
| Square | 17 |
| Wise | 14 |
| Cash App | 11 |
These percentages are shown in the brand visibility chart. The chart also shows visibility trends over the past week, revealing peaks and declines for each brand.
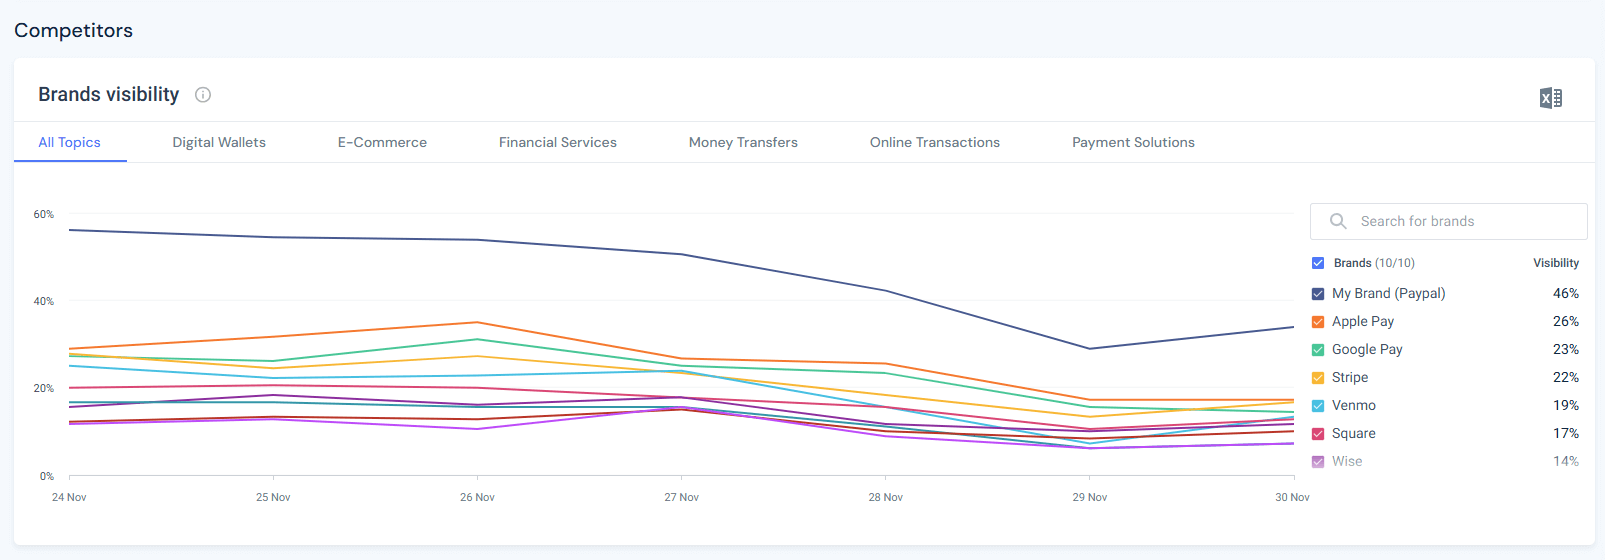
A key observation is that PayPal’s visibility is roughly double that of Apple Pay and Google Pay across all topics. Another observation is that all brands in this chart experienced a decline in visibility over the past 7 days. These baseline benchmarks provide context for deeper analysis.
The overall view isn’t granular enough to highlight variations across topics. However, I can drill down by clicking the topic tabs in the competitor chart. I recommend analyzing at least five topics relevant to my industry.
For the PayPal citation gap analysis, I’ll start with Digital Wallets, Ecommerce, Financial Services, Money Transfers, and Online Transactions.
For each topic, I’ll check visibility percentages for PayPal and the topic’s top competitors. Then I’ll check their visibility per topic vs their main competitors.
This process will reveal PayPal’s strengths and weaknesses in terms of visibility, as well as its competitors’ weaknesses, which can later be used for my GEO (Generative Engine Optimization) strategy and prioritization.
When switching to the “Digital Wallets” topic, the chart shows that Apple Pay leads with 58% visibility, followed closely by Google Pay at 52%, while PayPal’s visibility declines to 46%. Competitors like Venmo and Samsung Pay also appear, but with lower shares.
The chart below shows the data over time:
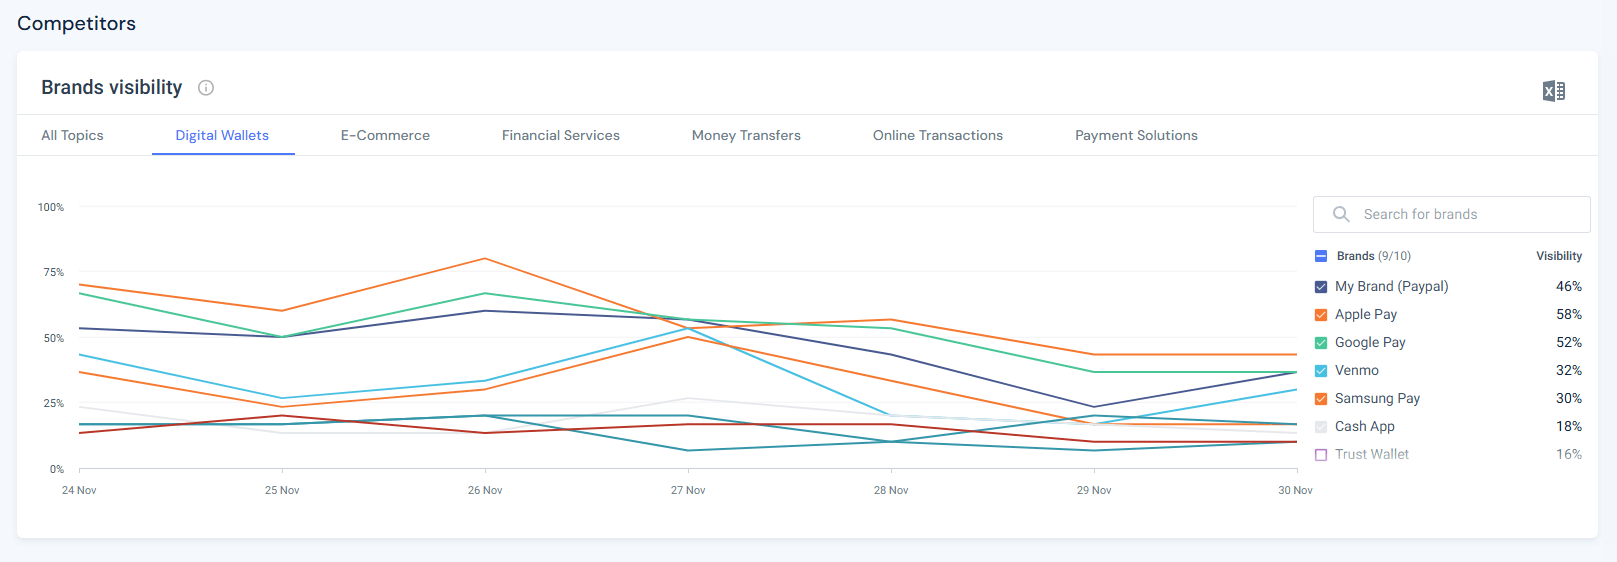
PayPal’s leadership in overall visibility does not translate to the Digital Wallets topic. Apple Pay and Google Pay dominate, highlighting a gap.
To close it out, I’d invest in creating content on PayPal’s digital‑wallet features, improve partnerships, and ensure high‑authority domains discuss PayPal in this context.
High authority domains get cited more by LLMs, which means they carry a double value:
This will create a cycle of constant seeding of LLMs with information that serves PayPal.
In the “Ecommerce” topic, the competitive set changes. Platforms like Shopify and WooCommerce, which are not direct payment services but act as an ecommerce infrastructure, appear. PayPal’s visibility is 26%, while Shopify leads with 39% and WooCommerce with 34%. Stripe appears at 19%.
See the past 7 days’ trend below: 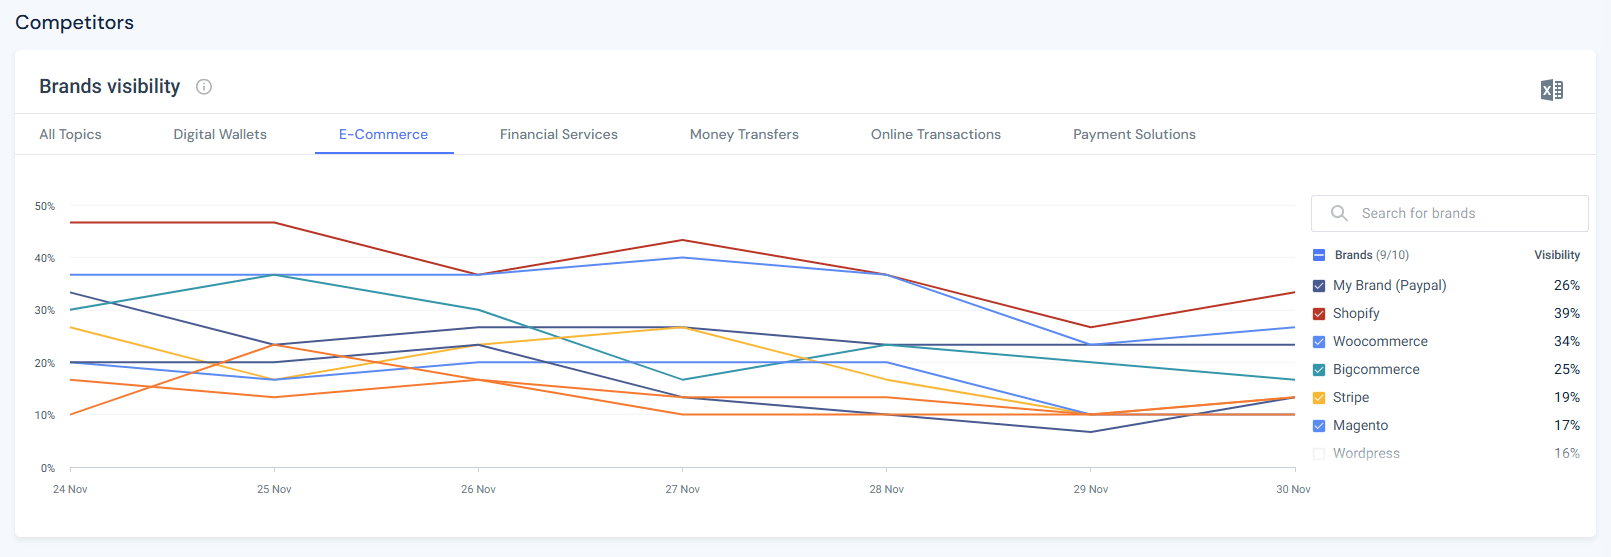
To improve, I’d recommend that PayPal integrate more closely with ecommerce ecosystems and encourage merchants to highlight PayPal’s benefits in documentation or support content that AI models might cite.
In the “Financial Services” topic, the field widens to include investment platforms. PayPal’s visibility is 19%, while Betterment, Wealthfront, and Revolut each range around 14%.
PayPal’s competitors from previous topics are nowhere to be found:
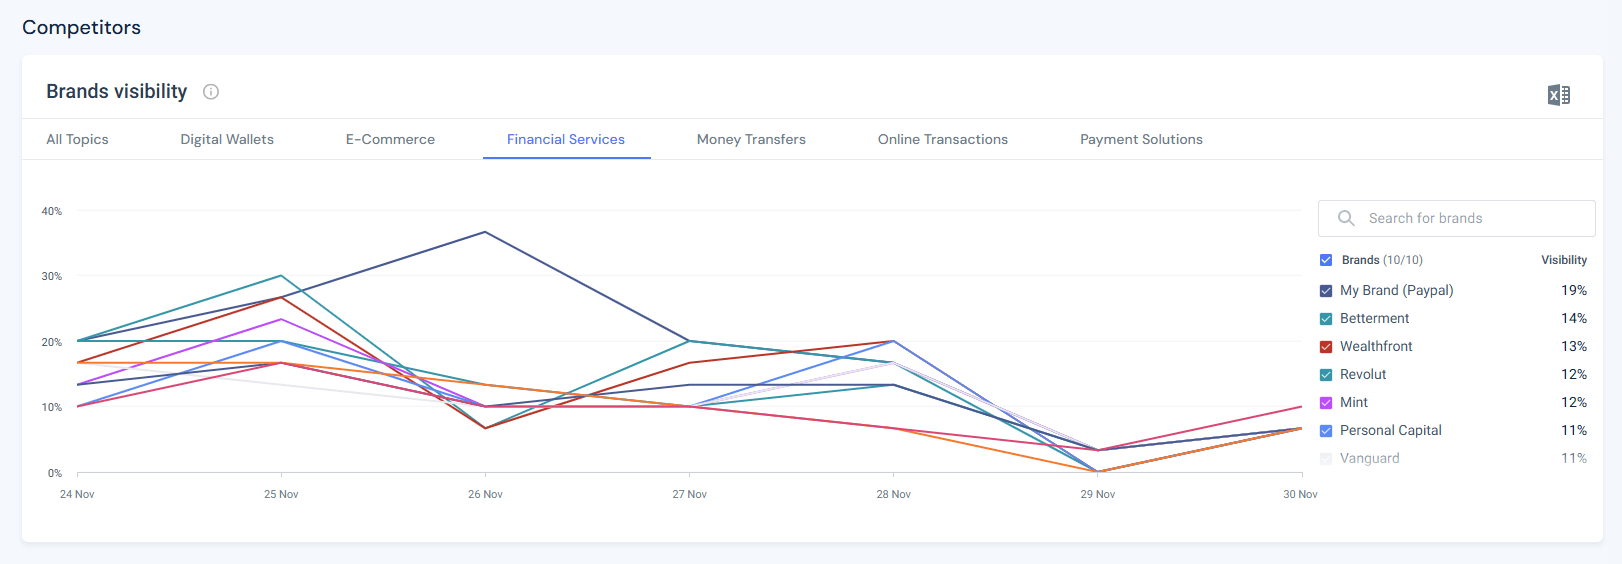
To maintain and grow visibility for this topic, I’d recommend continued investment in financial services content, thought leadership, and partnerships with relevant industry publishers to increase PayPal’s authority in these areas, thereby increasing its potential for citation.
Money transfers are PayPal’s historic core. Unsurprisingly, PayPal has 63% visibility, slightly ahead of Wise at 59% and Western Union at 48%.
Interestingly, in the 7-day visibility trend, PayPal led until November 28th, and on November 29th, Wise took over.
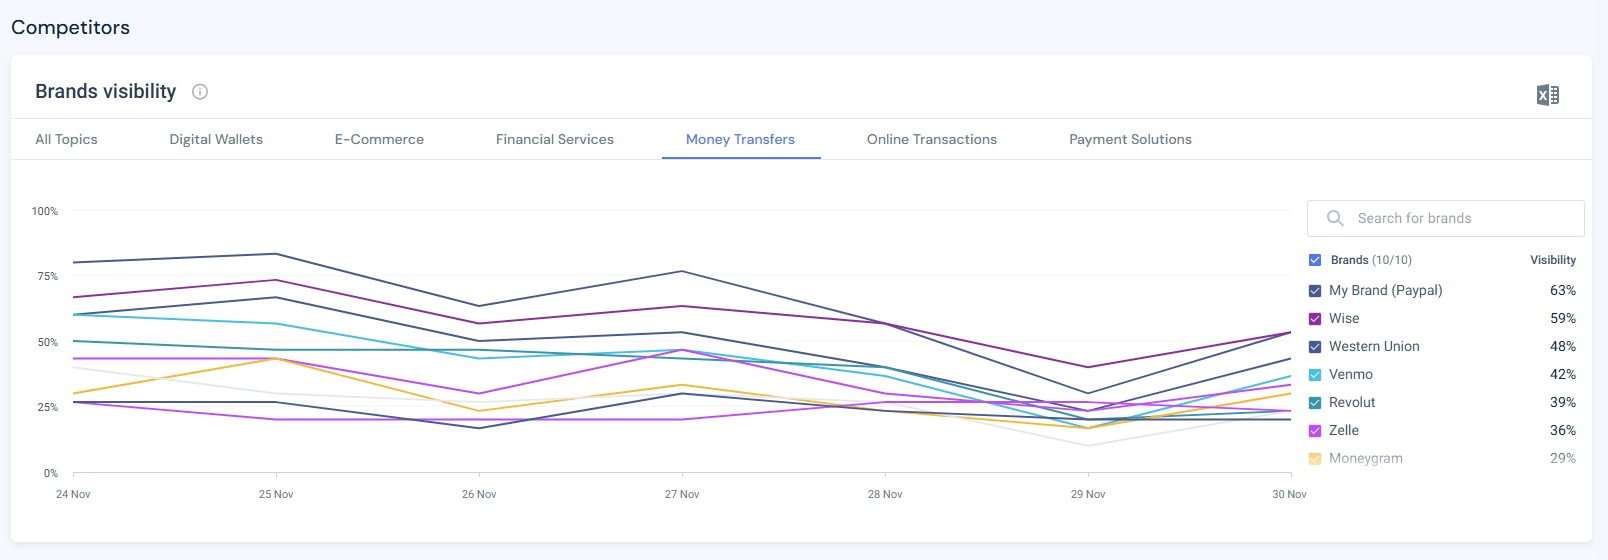
The money transfers topic is dominated by news websites & publishers. This means that proactively increasing citations from news or consumer‑finance domains about PayPal’s low fees, global reach, or consumer protections could defend this leadership.
The “Online Transactions” topic blends payments and checkout flows. Here, PayPal leads with 56% visibility. Stripe follows at 38%, with Apple Pay and Google Pay at 33% and 30%, respectively.
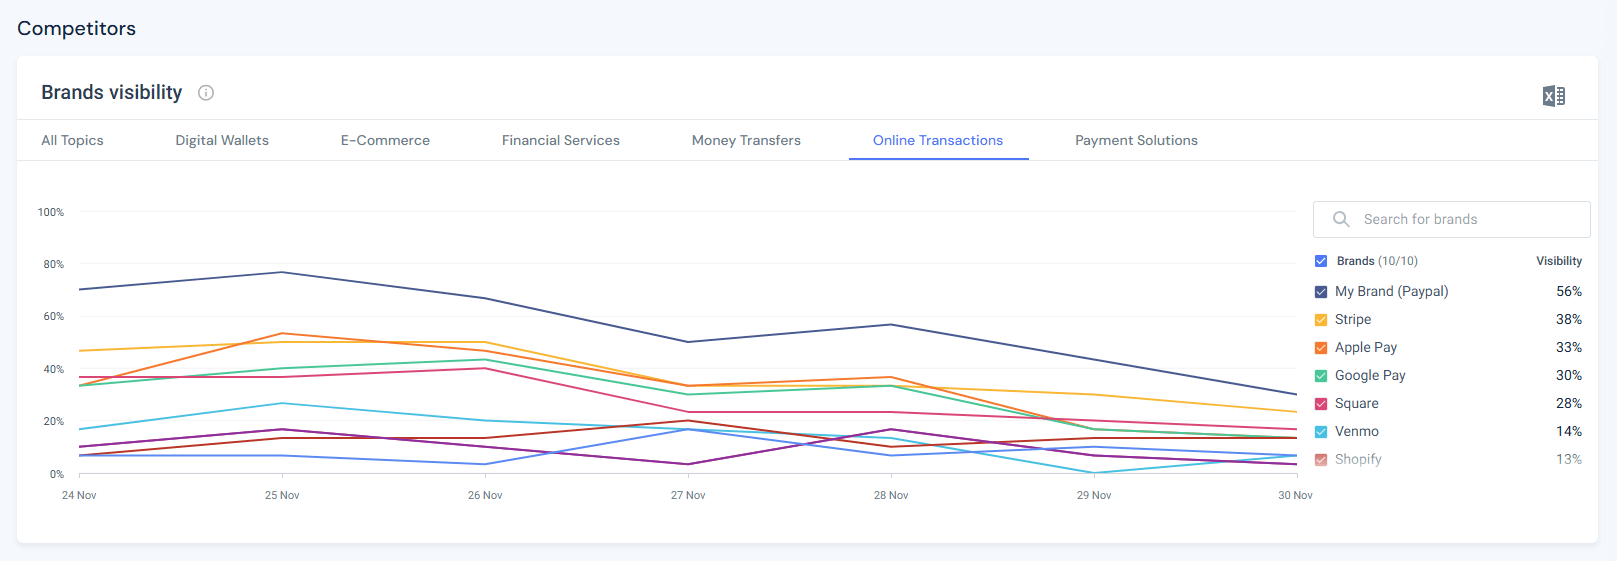
I’d focus on maintaining the highest share of visibility while also keeping an eye out for emerging players gaining visibility, developing partnerships with highly cited websites, and emphasizing security features in content to keep this advantage.
Now I’ll summarize all of PayPal’s visibility scores side-by-side vs its main competitors across topics:
| Topic | PayPal (%) | Apple Pay (%) | Google Pay (%) | Stripe (%) |
| All Topics | 46 | 26 | 23 | 22 |
| Digital Wallets | 46 | 58 | 52 | 6 |
| Ecommerce | 26 | 14 | 11 | 19 |
| Financial Services | 19 | 7 | 5 | 8 |
| Money Transfers | 63 | 18 | 18 | 6 |
| Online Transactions | 56 | 33 | 30 | 38 |
This table lets me quickly identify topics where PayPal lags behind competitors and where it leads.
In PayPal’s case, digital wallets and ecommerce stand out as areas to improve.
Now that I understand the top-level view of my brand visibility vs. my competitors, I can dive into analyzing my citation status relative to them and plan how to influence the topics I have just chosen.
So far, I’ve focused on visibility metrics. Next, I need to understand where citations come from. It’s time to start the main event and switch to the Citation Analysis tab. Here I can find metrics that show how often my domain is cited, from which domains, and with what influence.
At the top of the Citation Analysis tool, there are three key metrics:
The percentage of AI answers influenced by the citations from my domain. For PayPal, this value is 12%, meaning that 12% of ChatGPT’s answers in the last week referenced PayPal’s own website.
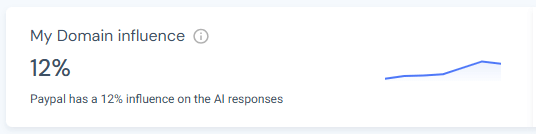
I can also see that my influence has increased over the past week, with a slight decline 2 days ago, meaning that my website was cited more times than last week.
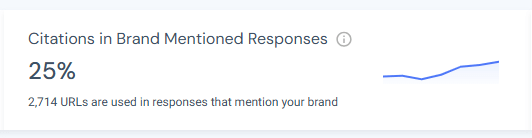
The number and percentage of URLs cited in answers that mention my brand. PayPal has 2,714 cited URLs, accounting for 25% of all citations in responses that mention PayPal.
The number and percentage of URLs cited in answers that do not mention my brand. PayPal has 8,251 URLs (or 75%) cited in responses where the brand is absent.
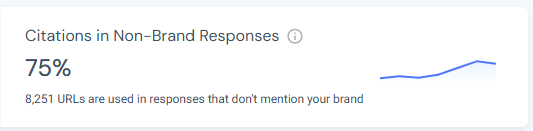
Non‑brand citations present opportunities:
Below these metrics, Similarweb displays a treemap of Top Domains. Each rectangle represents a domain, sized by the number of citations and colored by its influence score.
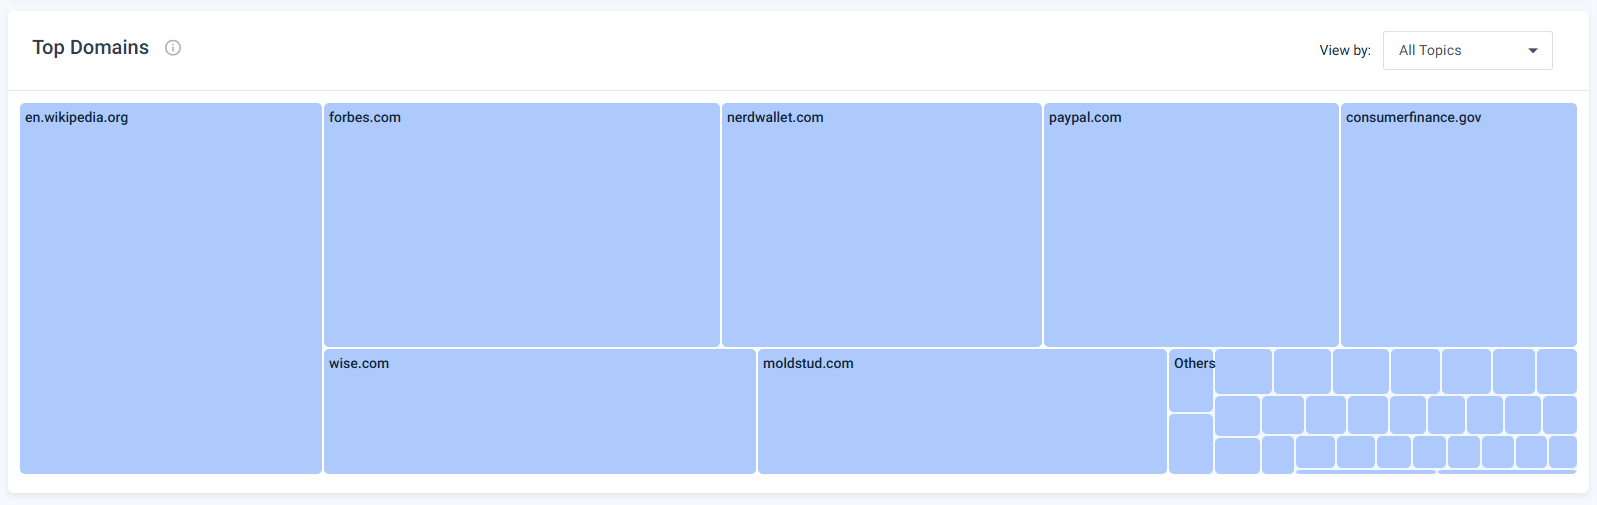
For PayPal, the largest domains being cited include en.wikipedia.org, nerdwallet.com, paypal.com, consumerfinance.gov, forbes.com, wise.com, and moldstud.com.
Scrolling further reveals a detailed table listing each cited URL, its domain, topics, influence score, source category, and the number of prompts in which it appears.
For example, the chart below shows me that almost 6.5K URLs are being cited in answers to prompt topics relevant to PayPal.
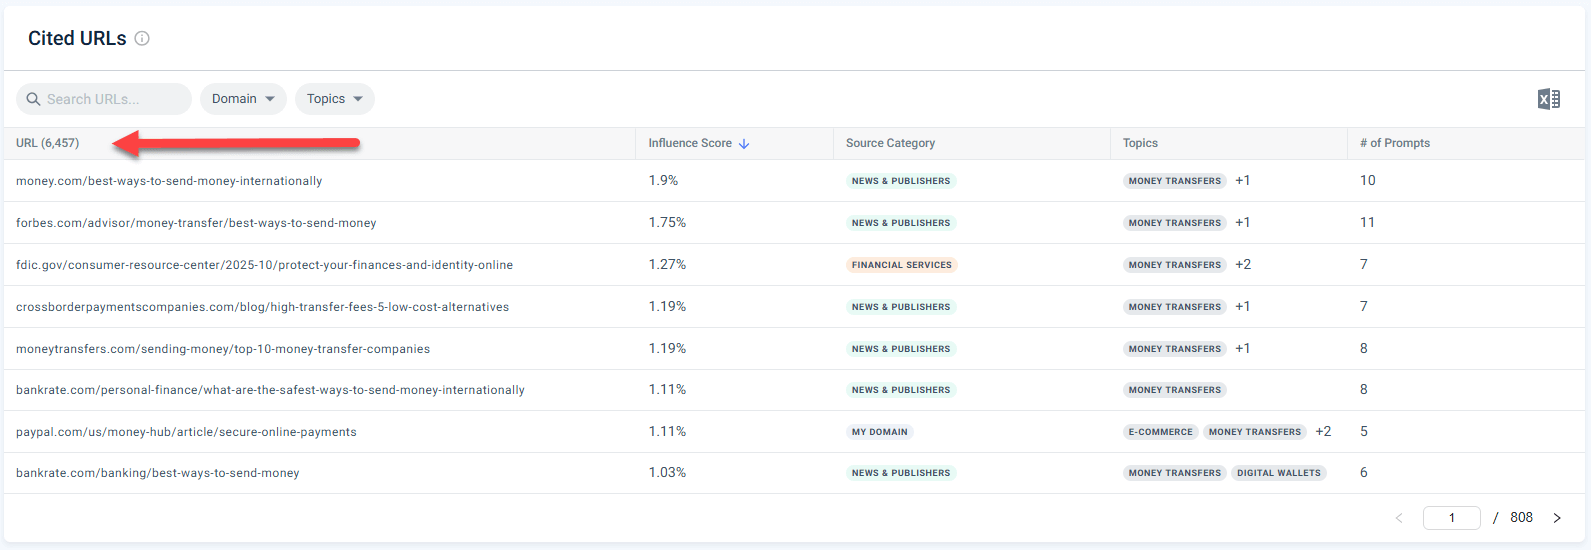
This is where I can benchmark the # of cited URLs, their influence scores, and the number of prompts they’re pulled into. This will allow me a more granular citation gap analysis when I compare my data to my competitors in the next step.
As promised, in the following steps, I will show how to use the tool’s filters to narrow down to specific topics, source categories, and source domains.
Now, I’ll check these base metrics for PayPal’s competitors
Now that I know PayPal’s citation metrics, I need to benchmark them against Apple Pay, Google Pay, and Stripe.
Similarweb allows me to switch to another brand within the same campaign via the dropdown at the top. For each competitor, I recorded the same metrics: My Domain Influence, Citations in Brand Mentioned Responses, and Citations in Non‑Brand Responses.
The results are compiled into the table below, giving me an overview across all metrics:
| Brand | Influence (%) | URLs in Brand Responses | % of Cited URLs (Brand) | URLs in Non‑Brand Responses | % of Cited URLs (Non‑Brand) | Total Domains Citing | Average URL Influence Score |
| PayPal | 12% | 2,714 | 25% | 8,251 | 75% | 3,391 | 0.13% |
| Apple Pay | 26% | 8,184 | 81% | 1,948 | 19% | 1,535 | 0.15% |
| Google Pay | 7% | 1,587 | 15% | 9,008 | 85% | 3,045 | 0.14% |
| Stripe | 9% | 1,054 | 10% | 9,548 | 90% | 3,835 | 0.13% |
After benchmarking high‑level metrics, I can drill down to pinpoint where to act. This involves two sub‑analyses: topic‑specific citation gaps and domain/URL gaps.
Within the Citation Analysis tab, I use the Topic filter to select a relevant topic (e.g., Digital Wallets). Record the number of citations and average influence for each competitor.
In my PayPal example, I found that URL influence scores are more important than the domain influence scores for AI visibility.
Apple Pay has the highest visibility score in this group. It has the most citations in the “digital wallets” topic and the highest average influence scores for cited URLs. Google gets mentioned by the highest-scoring domains, but judging from the final visibility result, not by enough highly influential URLs.
See the full chart:
| Topic: Digital Wallets | PayPal | Apple Pay | Google Pay | Stripe |
| Citations | 69 | 101 | 82 | 67 |
| Avg. Domain Influence | 0.21 | 0.26 | 0.27 | 0.22 |
| Avg. URL influence | 0.16 | 0.17 | 0.15 | 0.15 |
This shows that Apple Pay not only has more citations in digital‑wallet content, but also that those citations come from high-influence sites with the highest-influence URLs on my top target topic.
To increase my visibility and citation share, I suggest targeting URLs based on influence score, using the domain influence score only as a secondary decision metric. High-authority domains still matter, but when prioritizing resources and time, I like to focus on actions that can have the most impact.
The action plan would be to produce high‑quality digital‑wallet content and promote it on authoritative finance and tech domains.
Next, I click on the Top Domains treemap to view individual domains, or scroll down to the URLs section and use the filters. I chose NerdWallet.
Below are NerdWallet’s citations across the “digital wallets” topic:
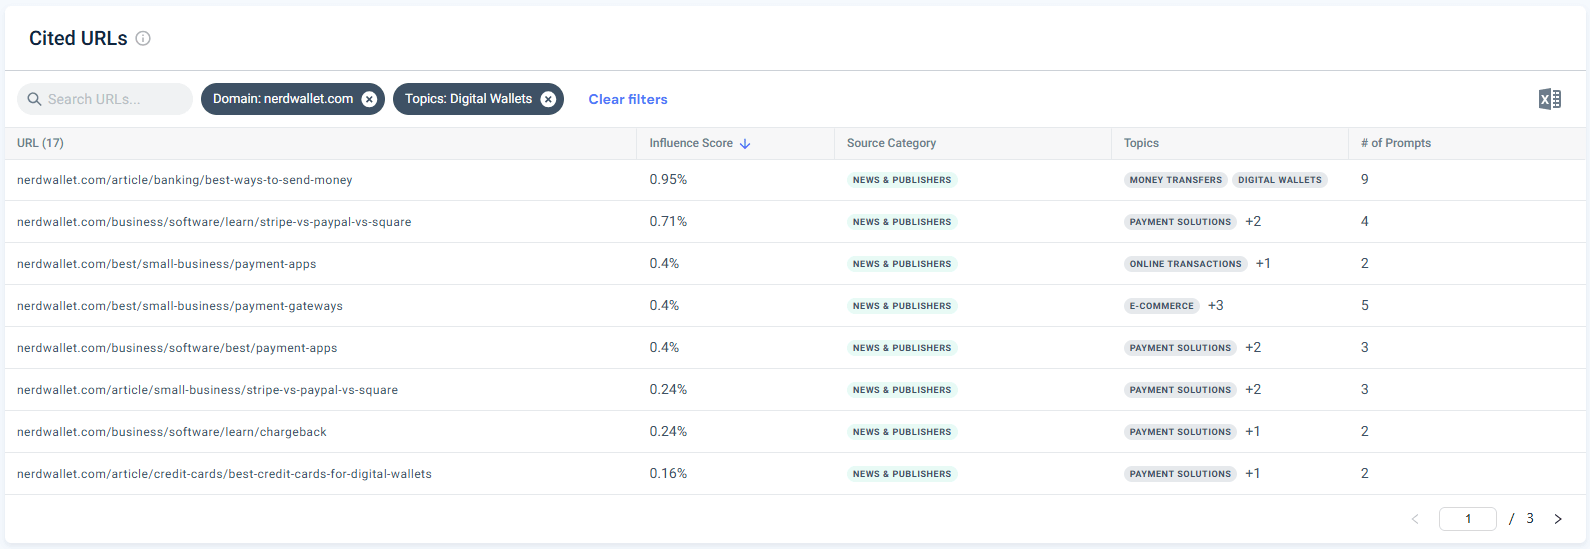
17 NerdWallet URLs were cited in 41 answers to prompts in the past 7 days, but PayPal was mentioned in only 30 of them. This accounts for 75% of mentions, which is pretty nice, but real perspective comes from examining what my competitors mention rates there as well.
Comparing this data to Apple Pay’s and Google Pay’s mentions in NerdWallet for this topic shows that Apple Pay got mentioned in 35 of the AI answers that cited NerdWallet, and Google Pay was mentioned 28 times.
Now I know that:
After collecting insights, it’s time to act. I put the data and insights I gathered so far to use and start building my plan:
Now I put everything I have on a calendar:
Measuring impact is critical to ensure ongoing growth.
Iterating on my actions and their impact on performance.
Expanding my source pool on an ongoing basis.
PayPal has many ways to close its citation gaps and increase its visibility in AI engines. If I were their SEO, I’d prioritize the following steps:
If you’d like to use my template to structure your research, feel free to do so. Just copy the template and modify the data to suit your industry and competitor landscape. I added a dedicated tab in the template for each analysis step to make it easier to follow.
Here’s a preview:
AI citation gap analysis is essential for brands seeking to remain visible in an increasingly AI-driven world. By systematically benchmarking your brand against competitors, drilling down by topic and domain, and planning targeted actions, you can identify patterns, close gaps, and increase your authority.
In my PayPal example, I discovered strong performance in money transfers and online transactions, but a weaker presence in digital wallets and ecommerce.
Now it’s your turn: using this guide, you can do the same for your brand and core topics.
With the DEEP framework and downloadable template, you now have a repeatable method for getting insights, optimizing your content strategy, and ensuring your brand is cited by AI engines across the topics that matter most.
AI citation gap analysis is the process of measuring how often your brand is cited in AI‑generated answers compared with competitors and identifying where you fall short. A citation gap analysis benchmarks your brand’s share of AI citations across topics, domains, and URLs, showing you where to focus content and outreach to increase citations.
Generative AI engines rely on retrieval‑augmented generation to search the web and prioritize relevant, trusted sources for their answers. If your brand isn’t among those trusted sources, AI search won’t mention it. By understanding your citation gaps, you can proactively optimize content, build partnerships with high‑authority domains, and ensure your brand appears in AI answers.
Use Similarweb’s AI Brand Visibility tool. Start in the Brand Overview tab and record metrics such as brand visibility and brand‑mention share. Next, compare your visibility across topics to identify where competitors lead. Finally, switch to each competitor’s profile to benchmark metrics such as domain influence and citation distribution between brand‑mentioned and non‑brand responses. Structured tables summarizing these metrics help expose gaps.
Because AI models update regularly, a quarterly or monthly cadence is recommended. Regular monitoring helps you detect shifts in competitor visibility, new high‑influence domains, and emerging topics. It also ensures your outreach and content efforts remain aligned with changing AI behavior.
Domain influence measures the percentage of AI answers that include citations from your own website. A higher domain influence indicates that your site is a trusted source. Competitors with higher domain‑influence scores are cited more often, suggesting stronger on‑site content or authority. Tracking this metric over time helps assess the impact of content improvements and outreach.
Yes. Publish high‑quality, authoritative content on your domain, especially in the form of definitive guides, FAQs, and research reports. AI models are more likely to cite sources that provide comprehensive answers. Ensure technical SEO best practices (structured data, clear headings, and more) are implemented.
Drill down into topic‑level visibility. In the competitor visibility chart, select each topic. Record the visibility percentage for your brand and competitors. Topics where your brand’s visibility is lower than competitors’ highlight citation gaps. Within those topics, use the citation analysis tab to see which high‑influence domains and URLs cite competitors but not you: these become priority outreach targets.
AI engines prioritize relevance, freshness, and trust. Content from high‑authority domains and URLs with strong E‑E‑A‑T (Experience, Expertise, Authoritativeness, and Trustworthiness) signals is more likely to be cited by AI engines. Targeting high‑influence domains ensures your content appears in the limited citations AI engines display.
Identify high‑authority domains with high influence scores that frequently cite competitors but not your brand. Reach out to these domains with relevant content such as case studies, research, or guest posts. Focus on topics where your brand has expertise and where competitor visibility is low. Building relationships with publishers increases the likelihood of citations, thereby improving AI visibility. Regularly performing citation gap analysis helps you spot new domains and emerging topics to target.
Director of SEO & AI Search at Similarweb
Limor brings 20 years of expertise in SEO and AI Search. She thrives on solving complex problems, creating scalable strategies, and building amazing dashboards.
Give it a try or talk to our insights team — don’t worry, it’s free!